Cyclic Voltammetry (CV) is a technical method for studying the behavior, kinetics, and rate-determining steps of electrochemical reactions at the electrode/electrolyte interface. This method is simple to test, rapid in response, and provides rich information from the cyclic voltammograms obtained. It has a wide range of applications in the fields of materials science, chemistry, environmental science, and biochemistry. Particularly, it is indispensable for advancing knowledge and technological progress in the field of electrochemistry. Through Cyclic Voltammetry, one can determine electrode reversibility, electrode reaction mechanisms, and perform quantitative analysis in electrochemical experiments.
Cyclic Voltammetry (CV) is an electrochemical analysis technique that studies the kinetics and mechanisms of electrochemical reactions by applying a linearly varying potential (voltage) to the electrode surface and monitoring the corresponding current response. This method involves controlling the electrode potential and recording the current that flows through the electrode during the potential change, resulting in a current-potential (i-E) curve graph.

Excitation signal diagram of cyclic voltammetry
In cyclic voltammetry measurements, a three-electrode system is commonly employed. The reason for using a three-electrode system is that during polarization, the potentials of the working electrode and the auxiliary electrode are changing. Additionally, the ohmic potential drop generated by the polarization current between the solution on the working electrode and the auxiliary electrode is also superimposed on the measured electrode potential, which can affect the test results.

Three electrode system
In cyclic voltammetry, the potential starts from an initial value and linearly increases at a certain scan rate to a set final potential, then reverses and scans back to the initial potential, forming a complete cycle. This process can be repeated multiple times to obtain detailed information about the electrochemical reactions. By analyzing the obtained cyclic voltammograms, important information about the redox peaks, peak potentials, peak currents, and reversibility of the reaction can be obtained.
Cyclic voltammetry typically includes the following key features:
Peak current: It indicates the rate of the redox reaction at a specific potential, and the magnitude of the peak is related to the reaction rate and the concentration of the analyte.
Several important parameters that can be obtained from a cyclic voltammogram are: anodic peak current (ipa), cathodic peak current (ipc), anodic peak potential (Epa), and cathodic peak potential (Epc). The method for measuring the peak current ip is: to draw a tangent line along the baseline and extrapolate it to the peak base, then draw a perpendicular line from the peak top to the tangent line, the height between them is the ip. Ep can be directly read from the horizontal axis at the corresponding position of the peak top.
Peak potential: The potential of the oxidation peak and the reduction peak, which can be used to identify specific redox reactions.
In the cyclic voltammogram, the reduction peak corresponds to the cathodic reaction, with the current being the cathodic current. The corresponding peak is the reduction peak, where the more positive the peak potential, the larger the peak current, and the easier the reduction. On the other hand, the oxidation peak corresponds to the anodic reaction, with the current being the anodic current. The corresponding peak is the oxidation peak, where the more negative the peak potential, the larger the peak current, and the easier the oxidation.
Separation of current peaks: If two peaks are well separated, it indicates that the two reactions have different kinetic properties, which helps to distinguish different redox processes.
Number of cycles: The number of times the potential completes the full process from the starting potential, through the set potential range, and back to the starting potential. The number of cycles is crucial for obtaining detailed information about electrochemical reactions and understanding the kinetic characteristics of the reactions. By observing the voltammograms of multiple cycles, the reversibility and stability of the reactions can be assessed.

Cyclic voltammetry voltage-current response curve
Reversible electrode:
a. The current-voltage curves in the positive and negative scanning stages of the cyclic voltammogram are symmetrical in shape.
At this time, the peak currents are equal: Ipc = Ipa. If a peak that originally existed disappears or a new peak is generated, it indicates that an irreversible reaction has occurred at the electrode interface.
b. The difference between the anodic peak potential and the cathodic peak potential is small,
Peak potential difference: Δφ = φpa - φpc = 2.22RT/nF (mV); when T = 25°C, Δφ = 55.6/n (mV)
c. Changing the scan rate does not affect the peak potential, which is independent of the scan rate.
Irreversible electrode:
a. Usually, there is a single peak, no reverse scan peak, or the positive and negative curves are asymmetrical, and the peak currents Ipc: Ipa are significantly greater than or less than 1.
b. The larger the difference between the anodic peak potential and the cathodic peak potential, the greater the degree of irreversibility.
c. Changing the scan rate, E moves with V, and the peak potential is significantly affected by the scan rate.

CV curve of an equilibrium electrochemical system
Quasi-reversible process:
The peak shape, peak potential, and peak current are related not only to the number of transferred charges, temperature, reactant/product concentration-diffusion, etc., but also to the potential scan rate. Generally speaking, as the scan rate increases, the potential difference Δφ between the oxidation peak and reduction peak of the quasi-reversible electrochemical reaction will gradually increase (as shown in the figure below). However, for a completely reversible electrochemical system, this situation does not exist. As shown in Figure 4, with the increase of scan rate, the potentials of the oxidation peak and reduction peak remain essentially unchanged.

CV curve of a quasi-equilibrium electrochemical system

Control steps of the electrode: Electroactive substances first undergo a diffusion process to reach the electrode surface, and then participate in the reaction by adsorbing onto the electrode surface through an adsorption process. The two consecutive processes are controlled by the slower process; for example, if the diffusion process is slower, it becomes the controlling process for the entire reaction.
Mechanism of electrode process control: If the peak current of the oxidation peak or reduction peak is directly proportional to the scan rate (linear relationship), it indicates that the electrode process is mainly controlled by the kinetic reaction. If the peak current has a linear relationship with the square root of the scan rate, the electrode process is mainly controlled by diffusion.
The figure below shows the linear scan curves of three catalysts for catalyzing the OER reaction, the catalysis of oxygen absorption by different metal compounds, and the corresponding Tafel curves obtained through transformation; the smaller the Tafel slope, the more the rate-determining step is at the end of the multi-electron transfer reaction, which is usually a sign of a good electrocatalyst. Among the three catalysts, the Fe0.33Co0.67OOH PNSAs/CFC sample has the smallest Tafel slope, indicating that the current density increases faster and the overpotential (η) changes less, which also indicates its better electrocatalytic performance.

In cyclic voltammetry experiments, a substance exhibits a distinct oxidation peak current at the electrode, and within a certain concentration range, the oxidation peak current of the substance is linearly related to its concentration. Therefore, based on the oxidation peak current of the substance at a given point, the concentration of the substance can be inferred from the linear relationship, allowing for the calculation of the substance's content. This method is generally used for trace analysis and identification of intermediate products.
Now, the new generation of high-performance battery testing systems already has the capability for cyclic voltammetry. For detailed step settings, please refer to the proess step file at the end of this document.


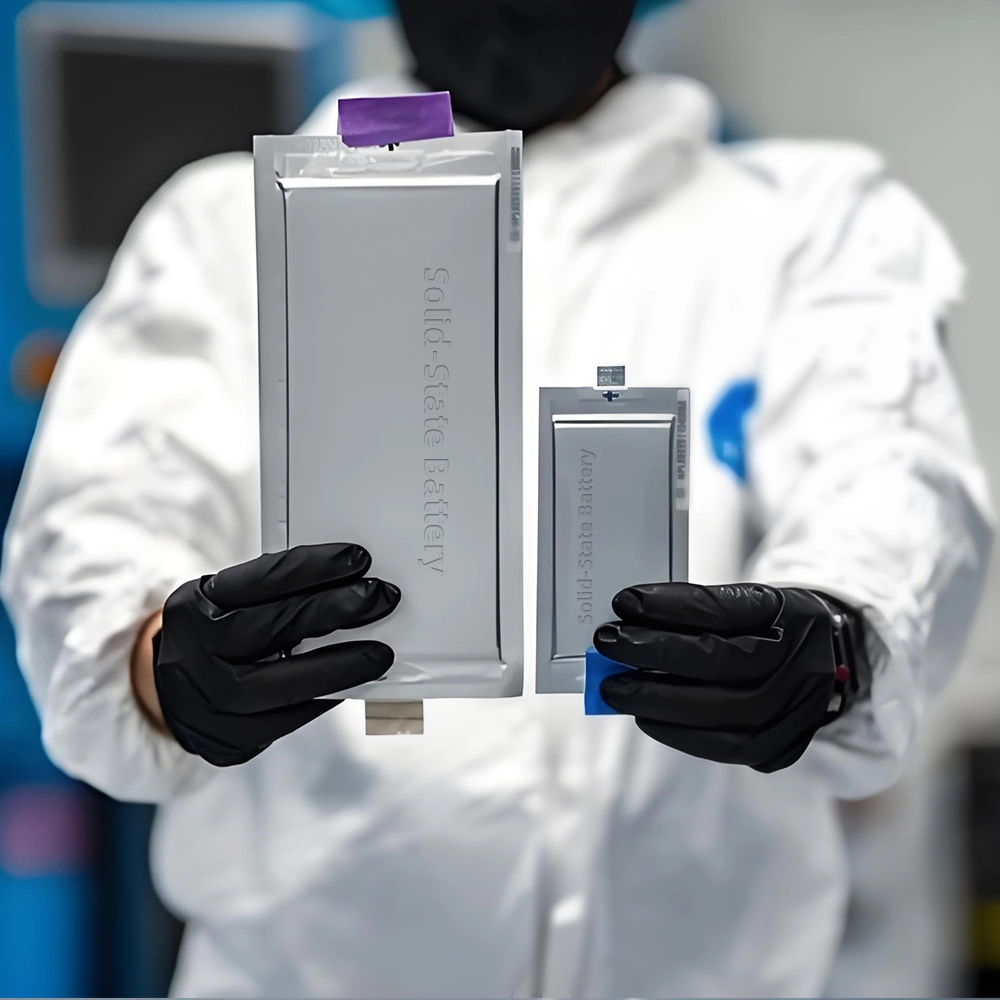
The lab focuses on solid-state battery research to overcome traditional lithium batteries' safety and energy density issues, supporting environmental sustainability. It develops innovative solid-state electrolytes, refines electrode materials, and investigates ion transfer and interface stability to revolutionize battery technology.

The electric vehicle battery industry is rapidly developing, focusing on technological innovation, market competition, and sustainability. Research hotspots include solid-state batteries, new types of electrolytes, BMS optimization, and recycling technologies. The environmental adaptability, safety, and economic viability of batteries are key research areas, and the industry is expected to undergo more innovation and transformation.

We specialize in battery preparation technology research, focusing on overcoming existing energy storage challenges by innovating in electrode materials, battery chemistry, and manufacturing processes to improve performance, enhance safety, and reduce costs. Sustainability and recycling technologies for batteries are also emphasized to mitigate environmental impacts and foster the growth of green energy.