1 Introduction to cycle performance testing
Battery cycle performance testing typically involves subjecting the battery to multiple cycles under specific charging and discharging conditions to simulate the actual operating conditions of the battery. The purpose of the test is to monitor the capacity fade of the battery during the cycling process, thereby assessing its cycle life and health status. Through charge / discharge cycles, performance parameters such as battery charge / discharge capacity, coulombic efficiency, and capacity retention rate can be tested. Common modes for battery charge and discharge testing in the laboratory include constant current charging/discharging (CC), constant voltage charging/discharging (CV), and constant current-constant voltage charging (CC-CV). In addition to the commonly used modes, other modes such as constant capacity charging and discharging, constant resistance discharging, and stepwise charging and discharging modes are also included. Constant current charging and discharging and constant current-constant voltage charging modes are generally used to test battery cycle life. Cycle performance testing can be conducted using charge and discharge equipment (Fig. 1).
Fig. 1 CT-4008Q-5V100mA-124 Battery Testing System
To ensure that the battery is in a steady-state environment, constant temperature chambers are often used to create a stable environment to avoid temperature fluctuations that can cause errors, or high and low temperature chambers are used to explore the cycle life of the battery at different temperatures. High temperature environments can accelerate the internal chemical reactions of the battery, leading to the decomposition of the electrolyte, the decomposition and thickening of the SEI film, and the decomposition of the positive electrode active materials. These reactions consume active lithium ions, reducing reversible capacity, and may also produce gases, increasing the internal pressure of the battery and affecting its safety performance. Low temperature environments reduce the ionic conductivity of the electrolyte, increase the internal resistance of the battery, and slow down the migration rate of lithium ions, resulting in reduced discharge capacity of the battery at low temperatures, but this capacity loss is usually reversible, and the capacity can be partially or fully recovered when the battery returns to room temperature. However, low temperature charging may cause uneven deposition of lithium ions on the surface of the negative electrode, forming lithium dendrites, which can lead to permanent damage to the battery performance. It is recommended to use a battery-specific environmental test chamber (Fig. 2) for convenient battery testing wiring and to ensure testing safety. An integrated machine that combines battery charging and discharging testing with temperature control of the test environment is an excellent choice for conducting battery temperature performance testing.

Fig. 2 WHW/WGDW Environmental Test Chamber series
2 Test step setting examples and instance data analysis
The test current can be calculated based on current density, such as current per unit mass of active material (mA/g), current per unit area of electrode (mA/cm2), to obtain the current in units of mA. The rate (C) can also be used to express it, where the rate (C) = charge and discharge current (mA) / nominal capacity (mAh). The nominal capacity of the electrode material or battery can be obtained by consulting literature.
The cycling performance work step settings or parameter settings for half-cells, full cells, and symmetrical cells are slightly different. Half-cells are used to study the electrochemical activity of electrode materials, such as the characteristics of redox reactions, reaction kinetics, and the interaction with the electrolyte. The electrode material is used as the working electrode and assembled with a lithium sheet (Li) to form a half-cell for testing. Taking the graphite//Li half-cell as an example, a current density of 100mA/g is chosen for testing. Assuming the active material mass is 0.01g, a charge and discharge current of 1mA is obtained. Half-cells generally use a low current density of 50 ~ 100mA/g, and the rate mode generally selects 0.1C. The work step setting is shown in Fig. 3. When studying anode materials, the battery generally undergoes a discharge work step first, following the sequence of rest-constant current discharge-constant current charge, with an input current of 1mA, a discharge cutoff voltage of 0.01V, a charge cutoff voltage of 1.0V, and the number of cycles set to 500. The setting of the voltage range depends on the electrode material. For example, for lithium iron phosphate//Li battery testing, the voltage range can be set to 2 ~ 4.2V, which can be obtained by consulting literature or testing the polarization curve.

Fig. 3 Example of cycling test work step settings for graphite//Li battery
Laboratories can perform full-cell cycle performance tests according to the work step settings used for half-cell tests, adjusting the voltage range based on the characteristics of the electrode materials and the tolerance of the electrolyte or solid-state electrolyte to oxidation voltage, and setting the current size as needed. The work step settings shown in the Figure below (Fig. 4) are one of the commonly used test methods for lithium battery cycle performance. The constant current-constant voltage charging followed by a 5min rest after charging completion is to optimize the charging process, allowing the battery to charge deeply and improve charging efficiency.

Fig. 4 Example of cycling test test step settings for lithium batteries
In addition, to explore the electrochemical behavior between electrode materials and electrolytes, as well as the impact on performance, symmetrical cells are prepared for long cycle life testing. The test steps are shown in Fig. 5. Constant current charging and discharging steps are set, with a time setting of 1h The current size is set according to a current density of 1mA·cm-2. Taking an electrode piece with a diameter of 1cm as an example, the current size of 0.785mA is obtained based on the current density and the area of the electrode piece. Finally, the cycling step is set, and it is recommended to set a larger number of cycles, and the test can be stopped after the test voltage is disordered.

Fig. 5 Example of cycling test step settings for symmetrical cells
3 Utilizing BTSDA for data review and performance analysis
After the test is completed, you can use BTSDA to view the battery cycle performance. You can set different curve contents to view different performance parameters. Right-click on the curve name position and click "Curve settings" to open the settings interface. Check the corresponding X-axis and Y-axis content according to your needs and click "Add curve" to complete. Fig. 6 shows the virtual machine test results, the "Cycle Index-Dchg.spec. Cap.&Chg. spec. Cap.&chg.-Dchg. Eff" curve, which can be used to observe the cycle stability and life decay trend of the battery, and check the capacity changes of the battery during the long cycle process and coulombic efficiency.

Fig. 6 Cycle performance
In addition to that curve, the "Spec. Cap.-Voltage" curve (Fig. 7(a)) is also a conventional curve for observing the capacity changes of the battery, to view the battery's discharge capacity, capacity at specific cycle numbers, etc. As shown in Fig. 7, it illustrates the charge and discharge curves of the battery after 100 cycles and the rate performance test under different currents, displaying the battery's cycle performance and rate performance with the "Spec. Cap.-Voltage" and "Cycle Index-Dchg.spec. Cap.&Chg. spec. Cap.&chg.-Dchg. Eff" curves.

Fig. 7 Charge/discharge test and rate test
Hao F, Liang Y, Zhang Y, et al. High-energy all-solid-state organic–lithium batteries based on ceramic electrolytes[J]. ACS Energy Letters, 2020, 6(1): 201-207.
Click to view the content related to rate testing.
The performance of a symmetrical cell is viewed by looking at the "Total time-voltage" curve. As shown in Fig. 8, the Li//LiCON//Li symmetrical cell is stably cycled for 500h (1h/cycle) at current densities of 0.05 and 0.1mA·cm-2, with the voltage remaining steady and no significant increase in overpotential or irreversible fluctuations.

Fig. 8 Symmetric cell test
To conveniently view the test result curves, double-click on any axis to open the "Axis settings", where you can set the unit of the axis, scale display range, the size and thickness of major and minor ticks, and the color of axis and curves, and other personalized detail settings. The BTSDA software provides various tools to facilitate data viewing and management. For example, the "Hand tool" and "Zoom in" can be used to move the curve and zoom in (Fig. 9(1)); when studying batteries, it is common to change a single variable to explore better electrode materials or test conditions. The "Curve comparison" (Fig. 9) is used to compare multiple test curves, making it easy to conduct parallel comparisons of data from different batteries and to directly observe the effects of performance improvement.

Fig. 9 "Curve comparison" function
There are also various tools such as "Parameter settings," and you can visit BTS Tutorial to view detailed video explanations of the BTSDA features.
4 Data export and plotting
After completing the test, it is necessary to export good data for plotting. There are several methods to export data.
The first method: If the currently viewed curve is "Spec. Cap.-Voltage" and "Cycle Index-Dchg.spec. Cap.&Chg. spec. Cap.&chg.-Dchg. Eff", right-click on any position and click "Copy data" to copy the curve data content into an Excel file (Fig. 10).

Fig.10 Cycle test data
The second method: Utilize the "Export report" and "Multi-channel Custom report" in the toolbar to export data. Open "Export report" (Fig. 11), select to export the "WYSIWYG report", set the export path and file name, and click export. It is recommended to export in Excel format for easy use with plotting software later. Note that the "What You See Is What You Get report" will export all data currently displayed in the right side of the software interface, with data from different levels copied according to the expanded content (Fig. 11).
If you do not need data such as time and voltage, collapse the step layer and record layer before exporting, so that only the cycle layer data will be exported. For other types of export reports, you can visit "BTS Tutorial" to view the video explanation.


Fig. 11 "Export report" feature; WYSIWYG (What You See Is What You Get) report


The lab focuses on solid-state battery research to overcome traditional lithium batteries' safety and energy density issues, supporting environmental sustainability. It develops innovative solid-state electrolytes, refines electrode materials, and investigates ion transfer and interface stability to revolutionize battery technology.

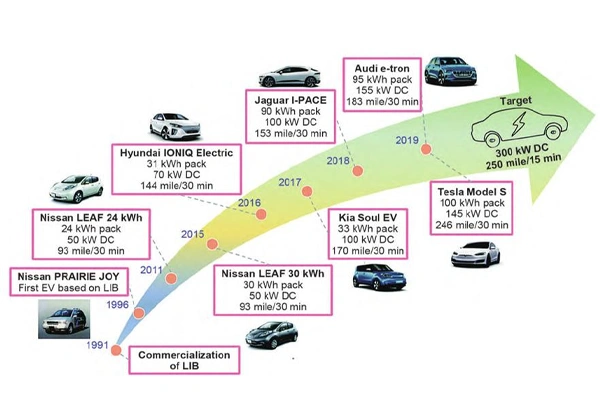
The electric vehicle battery industry is rapidly developing, focusing on technological innovation, market competition, and sustainability. Research hotspots include solid-state batteries, new types of electrolytes, BMS optimization, and recycling technologies. The environmental adaptability, safety, and economic viability of batteries are key research areas, and the industry is expected to undergo more innovation and transformation.
Specializing in battery preparation technology research, the focus is on overcoming existing energy storage challenges by innovating in electrode materials, battery chemistry, and manufacturing processes to improve performance, safety, and reduce costs. Sustainability and recycling technologies for batteries are also emphasized to mitigate environmental impacts and foster the growth of green energy.
