Electrochemical Impedance Spectroscopy (EIS) is an important technique in electrochemical testing, widely used for studying the kinetics of electrode processes and surface phenomena. In recent years, with the rapid development of frequency response analyzers, the accuracy of impedance measurements has significantly improved. EIS has found extensive applications in the field of electrochemistry, such as analysis of electrode processes (double layer and diffusion), investigation of battery electrode materials, solid electrolytes, conductive polymers, corrosion protection mechanisms, and more.
Electrochemical Impedance Spectroscopy (EIS) involves applying small-amplitude sinusoidal potential (or current) perturbations to an electrochemical system and measuring the corresponding current (or potential) response, resulting in an impedance spectrum. This spectrum reflects the variation of impedance with frequency in the electrochemical system, providing rich information about interface structures and kinetics.

The electrochemical system is considered as an equivalent circuit composed of basic elements such as resistors (R), capacitors (C), inductors (L), etc., connected in series or parallel. Through EIS, the numerical value of these elements can be quantitatively determined, and their electrochemical meaning can be utilized to analyze the structure of the electrochemical system and the nature of electrode processes.

EIS measures the impedance or admittance of an electrochemical system as a function of frequency by analyzing the response signals. Impedance and admittance are complex numbers that consist of a real part and an imaginary part, corresponding to the resistive and capacitive (or inductive) characteristics of the electrochemical system. These complex datas can be plotted as impedance spectra or admittance spectra, visually depicting the frequency-dependent variations of impedance or admittance in the electrochemical system.


EIS technique involves measuring the ratio of the perturbation signal X to the response signal Y at different frequencies (w or f), obtaining the real part Z', imaginary part Z", modulus |Z|, and phase angle f of the impedance at different frequencies. These quantities are then plotted in various forms to generate EIS spectra. These are two commonly used types of electrochemical impedance spectra: Nyquist plot and Bode plot.

Nyquist plot

Bode plot
(1) Causality Condition
The output response signal is solely caused by the input perturbation signal.
(2) Linearity Condition
There exists a linear relationship between the output response signal and the input perturbation signal. The current-potential relationship in an electrochemical system is determined by non-linear dynamic laws. However, when applying small-amplitude sinusoidal potential signals as perturbations, the relationship between potential and current can be approximated as linear. Typically, the amplitude of the sinusoidal potential perturbation is around 5mV and generally does not exceed 10mV.
(3) Stability Condition
The perturbation does not induce any changes in the internal structure of the system, and after the perturbation ceases, the system can return to its original state. Reversible reactions easily satisfy the stability condition. For irreversible electrode processes, as long as the changes on the electrode surface are not rapid, and the perturbation amplitude is small with a short duration, the system can recover to a state close to its original state, which can be approximately considered as meeting the stability condition.

Resistor: A point on the horizontal axis (real part) in the Nyquist plot.
Capacitor: A straight line that coincides with the vertical axis (imaginary part) in the Nyquist plot.

For a series RC circuit consisting of a resistor R and a capacitor C: In the Nyquist plot, it appears as a straight line intersecting the horizontal axis at R and running parallel to the vertical axis.

In a circuit with a resistor R and a capacitor C connected in parallel, the Nyquist plot is represented by a semicircle with a radius of R/2.

If the electrode process is controlled by charge transfer processes (electrochemical reaction steps) and the impedance caused by diffusion processes can be neglected, the equivalent circuit and impedance of the electrochemical system are represented as shown in the figure.

When the electrode process is controlled by electrochemical reaction steps, the Nyquist plot appears as a semicircle. Based on this, the control steps of the electrode process can be determined. From the Nyquist plot, it can directly determine RW (Warburg impedance) and Rct (charge transfer resistance). The value of Cd (double-layer capacitance) can be obtained from the angular frequency (w) at the top of the semicircle.

Note: In the impedance spectra, the frequency range that should exhibit pure capacitive or resistive characteristics actually shows a behavior that lies between the two, known as the "dispersion effect." This effect makes the shape of the impedance spectrum more complex, no longer a simple semicircle or straight line, but it exhibits a "dispersive" characteristic.
The occurrence of the dispersion effect is influenced by various factors. Firstly, the surface inhomogeneity, roughness of the electrode, and the presence of adsorbates can affect the capacitive behavior of the electrode, leading to the appearance of the dispersion effect. Secondly, factors such as ionic conductivity and concentration distribution in the electrolyte solution can also affect the dispersion effect. Additionally, sources of noise, errors, and other factors during the measurement process can interfere with the shape of the impedance spectrum, exacerbating the dispersion effect.
The presence of the dispersion effect makes the analysis of EIS data more complex. To accurately understand the nature and behavior of electrochemical systems, researchers need to use more sophisticated equivalent circuit models to describe the dispersion effect. These models often include additional components such as constant phase angle elements (CPE) to better fit the actual impedance spectrum data.
At the same time, measures need to be taken during the measurement process to minimize the impact of the dispersion effect. For example, optimizing the electrode preparation process to improve the uniformity and smoothness of the electrode surface, selecting suitable electrolyte solution and concentration to reduce the influence of ionic conductivity and concentration distribution on the dispersion effect, and using high-precision measurement equipment and methods to reduce the interference of noise and errors on the shape of the impedance spectrum.
If the charge transfer kinetics is not very fast and both the charge transfer process and diffusion process jointly control the overall electrode process, resulting in the presence of both electrochemical polarization and concentration polarization, the equivalent circuit of the electrochemical system can be represented simply as:

In the Nyquist plot, the diffusion-controlled process is represented as a straight line with a slope of π/4 (45°). When the electrode process is jointly controlled by charge transfer and diffusion processes, the Nyquist plot exhibits a semicircle in the high-frequency region and a 45-degree straight line in the low-frequency region throughout the frequency domain. The high-frequency region is controlled by the electrode reaction kinetics (charge transfer process), while the low-frequency region is governed by the diffusion of reactants or products involved in the electrode reaction. The straight line representing the diffusion impedance may deviate from the 45-degree angle due to reasons such as a rough electrode surface, resulting in partial spherical diffusion. Apart from the electrode potential, there is another state variable that introduces reactance during the measurement process.
For complex or special electrochemical systems, the shape of the EIS spectrum becomes more diverse and complex. The use of only resistors and capacitors is insufficient to describe the equivalent circuit; other electrochemical components such as reactance, constant phase elements (CPE), and other elements need to be introduced.


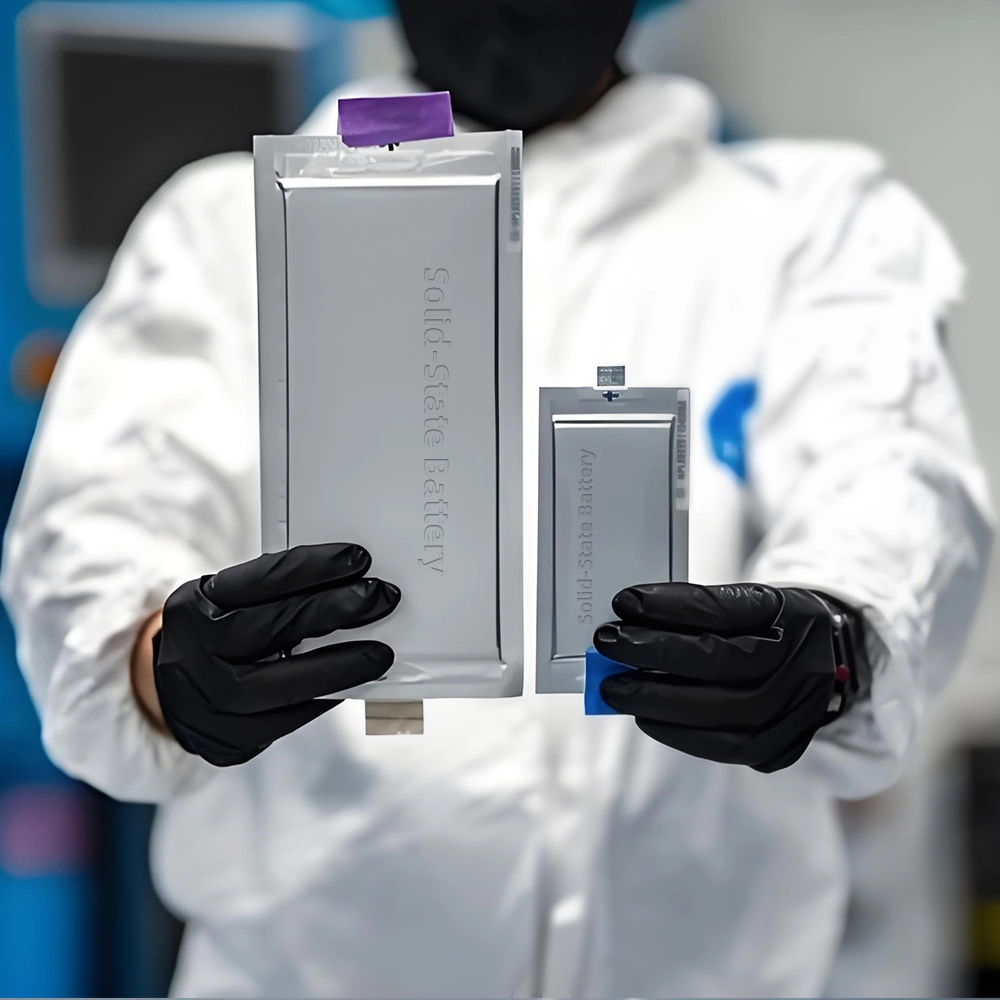
The lab focuses on solid-state battery research to overcome traditional lithium batteries' safety and energy density issues, supporting environmental sustainability. It develops innovative solid-state electrolytes, refines electrode materials, and investigates ion transfer and interface stability to revolutionize battery technology.

The electric vehicle battery industry is rapidly developing, focusing on technological innovation, market competition, and sustainability. Research hotspots include solid-state batteries, new types of electrolytes, BMS optimization, and recycling technologies. The environmental adaptability, safety, and economic viability of batteries are key research areas, and the industry is expected to undergo more innovation and transformation.

We specialize in battery preparation technology research, focusing on overcoming existing energy storage challenges by innovating in electrode materials, battery chemistry, and manufacturing processes to improve performance, enhance safety, and reduce costs. Sustainability and recycling technologies for batteries are also emphasized to mitigate environmental impacts and foster the growth of green energy.