Lithium-ion batteries have been widely used in portable electronic devices, electric vehicles and energy storage systems due to their high energy density, long cycle life and low self-discharge rate. However, the performance of batteries gradually decays with the increase of usage time. In order to gain a deeper understanding of the working principle and decay mechanism of batteries, it is essential to characterize the batteries using a variety of electrochemical test methods. Among them, dQ/dV analysis is an important electrochemical test method, which reveals the electrochemical reaction process inside the battery by analyzing the relationship between the change in capacity (dQ) and the change in voltage (dV) during the charging and discharging process.
1. dQ/dV test principle
1.1 Basic concepts
The dQ/dV test method, i.e. differential capacitance test method, obtains the dQ/dV curve of a battery by measuring the relationship between the rate of change of the capacity (dQ) and the rate of change of the voltage (dV) of the battery during charging and discharging. The curve can reveal the electrochemical reaction process inside the battery, including phase change, solid solution reaction, etc. It is an important tool to study the battery performance and decay mechanism.
1.2 Physical significance
The shape of the dQ/dV curve and the position of the characteristic peaks are closely related to the electrochemical reaction process inside the cell. By analyzing the shape and characteristic peaks of the dQ/dV curve, the reaction kinetics, phase transition process and interface reaction inside the cell can be understood.
1.3 Mathematical expressions
The mathematical expression for the dQ/dV test is:
Where ΔQ represents the small change in the capacity of the battery during charging and discharging, and ΔV represents the small change in voltage. When ΔV tends to zero, ΔQ/ΔV is the instantaneous capacitance of the battery.
Therefore, it is easy to understand that, when the capacity released or charged by the lithium battery becomes more per unit voltage range (i.e., the plateau region, which indicates an electrochemical reaction process), the value of dQ/dV will increase, and the curve will show the characteristic of "peak", which corresponds to the oxidation-reduction peak of CV curve. dQ/dV curve peak shift and attenuation have some analytical value. The movement and attenuation of the peak position of dQ/dV curve has certain analytical value, such as the movement of the peak position indicates that the platform potential changes (which is not easy to detect on the full battery curve), the embedding and disengagement resistance of lithium ions increases, and the polarization impedance increases, while the attenuation of the peak position indicates that the capacity per unit of voltage is reduced, and the shortening of the platform area reflects the loss of the active material. The separation of the main peaks of the redox pairs can be better realized by the method of differential quotienting, so that the charging and discharging plateau changes can be visualized.
Whether the dQ/dV curve is smooth or not has an effect on the voltage acquisition precision of the charging and discharging equipment, current control precision, temperature stability, and the density of picking points. As shown in the figure below, when the density of collection points is too dense, due to the lack of precision of the equipment, the differential curve fluctuates greatly, generating a large phi, and it is impossible to recognize the peaks, while when the density of collection points is too sparse, the peaks become rounded, and the sensitivity of the curve is reduced.
2. dQ/dV test procedure
2.1 Equipment preparation
The following equipment is required to perform the dQ/dV test:
Electrochemical workstation: Used to control the charging and discharging process of the battery and to record voltage and capacity data.
Computers and related software: for data acquisition, processing and analysis.
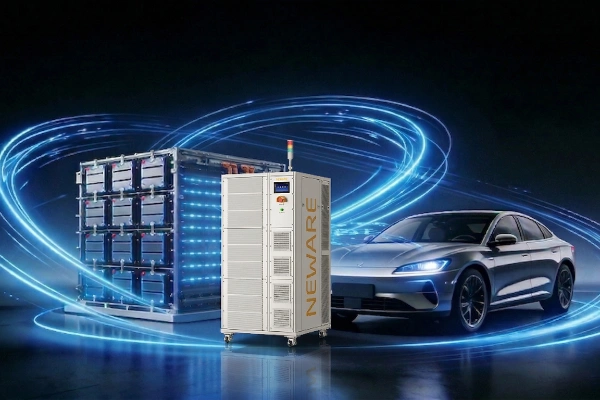
The following Neware multi-channel battery test system (CT-4008Q-5V100mA) was chosen to perform the charge/discharge test.
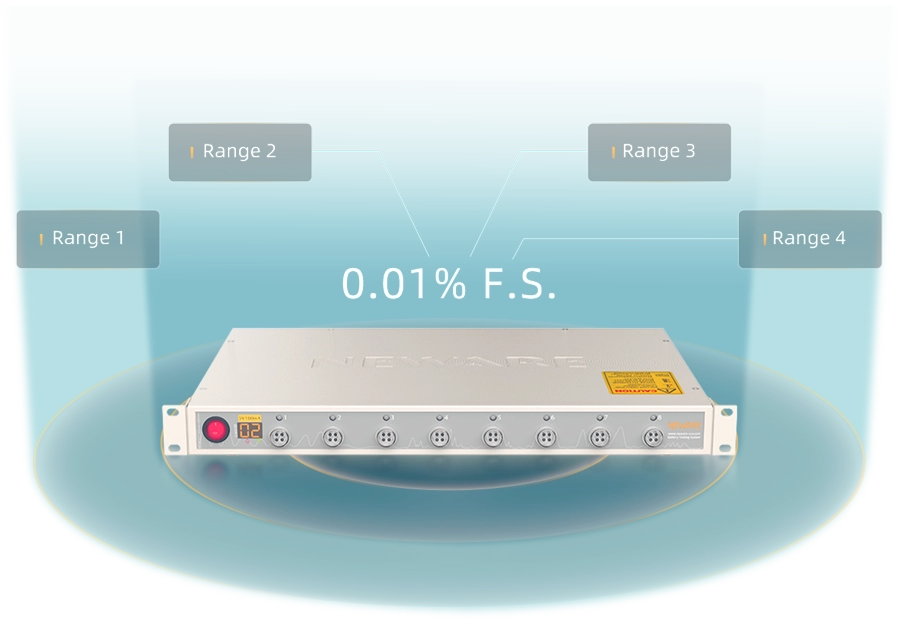
Figure 1 NEWARE Multi-Channel Battery Test System
NEWARE multi-channel battery test system integrates GITT test, constant current charge/discharge test, constant voltage charge test and other test methods. At the same time, it also has GITT data and dQ/dV data processing functions. Therefore, according to the above test process, after setting small current to test the battery, directly select the corresponding dQ/dV function for processing, export or copy the data to Origin, and then get the dQ/dV curve after graphing. For more details about Neware multi-channel battery test system, please contact Neware staff.
2.2 Test work step program
The work step setup and testing was performed using Sunway BTS 8.0 software. dQ/dV testing is usually performed in constant current charge/discharge mode, where the capacity change of the battery is recorded by gradually changing the charge/discharge current and voltage.
Constant Current Discharge: Discharge the battery at a constant current and record the voltage and capacity data.
Standing: After discharging, let the battery stand for a period of time so that the voltage and capacity can reach the equilibrium state.
Constant Current Charging: Charge the battery at a constant current and record the voltage and capacity data.
Constant voltage charging: When the battery voltage reaches the set value, switch to constant voltage mode and continue charging until the current drops below the set value.
Resting: After charging, let the battery rest for a period of time so that the voltage and capacity can reach the equilibrium state.

Fig. 2 Test program recording condition parameters
2.3 dQ/dV data acquisition
During the charging and discharging process, voltage and capacity data are recorded in real time to ensure data continuity and accuracy. The data acquisition frequency should be high enough to capture subtle changes in the internal reactions of the battery.

Figure 3 Curve Settings

Fig. 4 Curve parameter setting
3. Data processing and mapping
3.1 Data smoothing
Since the data may be affected by noise during the testing process, it is necessary to smooth the data before performing dQ/dV analysis. Commonly used smoothing methods include moving average method, Gaussian smoothing method, etc.
3.2 Differential calculations
Differential calculations are performed on the smoothed data to obtain the dQ/dV curve of the cell. Numerical differentiation methods can be used, such as center difference method and forward difference method.
3.3 Plotting the dQ/dV curve
The dQ/dV data obtained from differential calculations are plotted as a graph, and the shapes and characteristic peaks of the curves are analyzed to reveal the electrochemical reaction process inside the cell.

Fig. 5 dQ/dV curve
4. Analysis of dQ/dV test results
4.1 Basic features of the dQ/dV curve
The shape and characteristic peaks of the dQ/dV curve reflect the electrochemical reaction process of the battery during charging and discharging. By analyzing the peaks on the dQ/dV curve, the potential intervals of the electrochemical reactions occurring inside the battery can be determined, and then the lithium embedding/delithiation process of the electrode materials can be understood. The peak area is closely related to the capacity change of the battery, and by analyzing the peak area on the dQ/dV curve, the capacity and efficiency of the battery can be evaluated. The peak shape reflects the kinetic process of the reaction inside the battery. By analyzing the peak shape on the dQ/dV curve, the reaction rate of the electrode material and the multiplicity performance of the battery can be evaluated. Common dQ/dV curve features include:
Spikes: correspond to phase transitions or interfacial reactions occurring within the cell.
Wide peaks: correspond to solid solution reactions occurring within the cell or progressive lithium embedding/delithiation processes in the electrode material.
Plateau: Corresponds to the stabilized voltage region inside the cell, usually related to the equilibrium potential of the electrode material.
4.2 dQ/dV curves for different cell materials
4.2.1 Lithium cobaltate (LiCoO2) batteries
Lithium cobaltate (LiCoO2) batteries exhibit significant phase transition processes during charging and discharging, and their dQ/dV curves usually have multiple sharp peaks and plateaus. These characteristic peaks and plateaus correspond to different phase transition and electrochemical reaction processes. The dQ/dV differential technique is applied to study the modification mechanism of elemental doping on lithium cobaltate, and it is found that Mg-Al-Eu co-doped LiCoO2 can effectively inhibit oxygen precipitation and deconstruction at the interface, and the reversibility of the phase transition between O3 and H1-3 is greatly improved. As shown in Fig. 6 in the dQ/dV curves, the phase transition peaks from H1-3 to O3 can be observed at about 4.5 V in all three cells at the second cycle, while they disappear after 100 and 200 cycles in LCO and LCO - MA, respectively. On the contrary, in LCO - MAE, the H1-3 to O3 phase transition peak at the 300th cycle almost coincides with the 2nd cycle, indicating a significant enhancement of phase transition reversibility.

Fig. 6 dQ/dV curves of LCO (b), LCO-MA (c) and LCO-MAE (d) at different cycles; (a) dQ/dV curve of the 2nd cycle.
Literature (Tan X, Zhang Y, Xu S, et al. High-entropy surface complex stabilized LiCoO2 cathode[J]. Advanced Energy Materials, 2023, 13(24): 2300147.)
4.2.2 Lithium nickel-cobalt manganese (NCM) batteries
The dQ/dV curves of lithium nickel manganese cobaltate (NCM) batteries usually have wide peaks and plateaus, reflecting the solid-solution reaction and gradual lithium embedding/de-lithiation process of the NCM materials during charging and discharging.
The researchers prepared a homogeneous coating of poly(4-vinylbenzyl)trimethylammonium bis(trifluoromethanesulfonimide) (PVBTA-TFSI) on NCM as shown in Fig. 7. This extremely thin cationic polymer coating with a thickness of only 2-4 nm helped to stabilize the interface between the NCM and the Li6PS5Cl solid electrolyte (SE), which effectively inhibited the degradation of the NCM/SE interface and reduced the degree of particle cracking. By applying the dQ/dV discretization technique, it was concluded that the electrochemical degradation at the NCM/SE interface of 5P-NCM and 1P-NCM was less than that of pristine NCM below 3 V. Moreover, the polymer coating in 1P-NCM reduced the electrochemical degradation below 3 V but increased the overpotentials as compared with pristine NCM and 5P-NCM.

Fig. 7 Comparison of dQ/dV curves for (a) 0.1C 1st cycle and (b) 0.1C 25th cycle.
Shi B X, Yusim Y, Sen S, et al. Mitigating Contact Loss in Li6PS5Cl-Based Solid-State Batteries Using a Thin Cationic Polymer Coating on NCM[J]. Advanced Energy Materials, 2023, 13(24): 2300310.
4.2.3 Lithium iron phosphate (LiFePO4) batteries
The dQ/dV curves of lithium iron phosphate (LiFePO4) batteries usually have smoother peaks and plateaus, reflecting the electrochemical reactions and potential stability of the LiFePO4 material during charging and discharging.
As shown in Fig. 8, by observing the dQ/dV curves of the LiFePO4/graphite full cell, it can be concluded that the graphite anode undergoes five different phases from C6 to LiC6 due to the embedding of Li+ between the carbon layers. At C/48, five peaks can be recognized in the ICA of the LiFePO4/graphite cell, which may correspond to four phase transitions in the negative electrode and one phase transition in the positive electrode.

Fig. 8 dQ/dV curve of lithium iron phosphate/graphite full cell
Fly A, Chen R. Rate dependency of incremental capacity analysis (dQ/dV) as a diagnostic tool for lithium-ion batteries[J]. Journal of Energy Storage, 2020, 29: 101329.
5. Conclusions and outlook
5.1 Advantages of dQ/dV analysis
The dQ/dV analysis method provides an important tool for battery performance evaluation and optimization by revealing the electrochemical reaction processes during battery charging and discharging. Its advantages include:
High sensitivity: capable of detecting small changes inside the battery.
High resolution: able to discriminate between different electrochemical reaction processes.
Non-destructive testing: no damage to battery samples.
5.2 Prospects for the application of dQ/dV analysis
With the continuous development of battery technology, the application of dQ/dV analysis method in battery research is promising. In the future, dQ/dV analysis method will play a greater role in the following aspects:
Development of new materials: To study the electrochemical reaction process of new battery materials through dQ/dV analysis method, and to promote the development and application of new materials.
Battery performance optimization: Optimize the design and manufacturing process of the battery to improve the performance and life of the battery through dQ/dV analysis method.
Battery fault diagnosis: Through dQ/dV analysis method, diagnose the cause of battery failure, provide scientific basis for battery maintenance and repair.