Hybrid Pulse Power Characterization (HPPC) is an important testing method for evaluating the performance of power batteries. This method is primarily used for performance evaluation and power system management of battery systems, modules, and single cells in hybrid vehicles. This article mainly discusses the principle and method of HPPC testing, and subsequent articles will share practical application cases of HPPC. Please stay tuned.
HPPC is a characteristic test used to reflect the pulse charge and discharge performance of power batteries. The characteristic curve of the HPPC test is shown in Figure 1(a). Its purpose is to demonstrate the power assist targets at different depths of discharge (DOD) for discharge pulses and regenerative charge pulse power capabilities.

Figure 1 HPPC test characteristic curve (a) and complete HPPC test process (b)
The HPPC test process is a simple repetition of the characteristic curve in Figure 1(a). The test starts from a fully charged state, discharging by 10% DOD each time, followed by a rest period of 1 hour and then performing pulses until 100% DOD is reached, ending with a 1-hour rest period as shown in Figure 1(b). The 1-hour rest is to allow the battery to reach electrochemical and thermal equilibrium. The voltage during each rest period needs to be recorded to establish the battery's Open Circuit Voltage (OCV) curve. Test pulse currents use two peak currents: low current (25% of Imax) and high current (75% of Imax), where Imax is the maximum allowable 10s pulse discharge current determined by the manufacturer.
The open circuit voltage (OCV) is the value at the end of each HPPC rest period and can be plotted as a function of the depth of discharge (DOD). Based on the test data points, the OCV at other DOD values can be estimated by linear interpolation or data fitting curves, as shown in Figure 2.
According to equations (1) and (2) and Figure 1, the discharge and regenerative charging resistances for each test can be determined using the ΔV/ΔI calculation, as shown in Figure 2.
RDischarge = (Vt1 - Vt0) / -(It1 - It0) = (Vt1 - Vt0) / (It0 - It1) (1)
RCharge = (Vt3 - Vt2) / -(It3 - It2) = (Vt3 - Vt2) / (It3 - It2) (2)

Figure 2 Relationship between open circuit voltage and pulse resistance and depth of discharge
From the voltage and resistance characteristics, the pulse power capability can be derived and plotted as a function of DOD. The pulse power capability includes the Vmin discharge capability and Vmax regenerative charge capability, where Vmin and Vmax are the minimum and maximum working voltages of the battery cell. Using equations (3) and (4), the corresponding resistance and OCV at each DOD can be found from Figure 3 and the discharge power and regenerative charge pulse power can be calculated.
PDischarge = Vmin × (OCV - Vmin) / RDischarge (3)
PCharge = Vmax × (Vmax - OCV) / RCharge (4)
These power capability values can determine the change in usable depth of discharge and energy values. An example of the relationship between power capability and DOD is shown in Figure 3. When determining DOD values, the capacity consumed by discharge pulses must be considered, resulting in a lag in the regenerative charge DOD values.

Figure 3 Relationship between pulse power capability and depth of discharge
Usable energy is defined as the energy that can be obtained from a 1C discharge of the battery system. The steps to determine usable energy include: establishing the relationship between HPPC power and 1C discharge energy at different depths of discharge; using the Battery Size Factor (BSF) to scale the energy and power; determining the minimum and maximum DOD values that meet the target requirements of the test manual; and calculating the usable (1C discharge) energy over the discharge region precisely meeting the target.
As shown in Figure 4, the power-energy curve can be derived by replacing the DOD values with energy values in the 1C discharge HPPC data. The power-energy values obtained at the single-cell level can be scaled using the size factor (BSF) and compared with the FreedomCAR indicators. Figure 4 shows the magnified results using a size factor of 40. By adding a horizontal line representing the power target in the figure, the usable energy can be determined at the intersection of the horizontal line and the curve. The usable energy in Figure 4 is approximately the difference between 1330Wh and 480Wh, i.e., 850Wh. This 850Wh result exceeds the minimum power target of 300Wh by 550Wh, which is necessary at the beginning of the battery's life because power capability and usable energy degrade over the battery's life, and the power and energy targets must still be met at the end of life. The point at which the energy margin reduces to zero marks the end of the battery's life.

Figure 4 Determining usable energy
Usable power is the maximum discharge power capability when the usable energy meets the minimum value required by the FreedomCAR test manual. This parameter is mainly used to examine the degradation of the battery over its entire life cycle. Usable power and usable energy reflect two complementary aspects of battery performance at any given time, as shown in Figure 5.

Figure 5 Curve of usable energy versus power
For system life testing, power and energy decay rates are used. The changes in usable power and usable energy over time need to be tested periodically at specific points and expressed as a percentage of the initial (BOL) values, as shown in equations (5) and (6).
Power Decay (%) = 100 × (1 - Usable Power / Initial Usable Power) (5)
Energy Decay (%) = 100 × (1 - Usable Energy / Initial Usable Energy) (6)
The minimum and maximum DOD values that meet the (FreedomCAR) electric vehicle system power targets can be determined using the same HPPC data and scaling factors as in Figure 4, but plotted against the original HPPC test DOD values (without converting the horizontal axis to energy values). As shown in Figure 6, the minimum and maximum DOD values meeting the power assist targets are approximately 28% and 76%, respectively, while the maximum DOD value meeting the usable energy target is about 57%.

Figure 6 Minimum and maximum DOD values meeting (freedomCAR) system targets


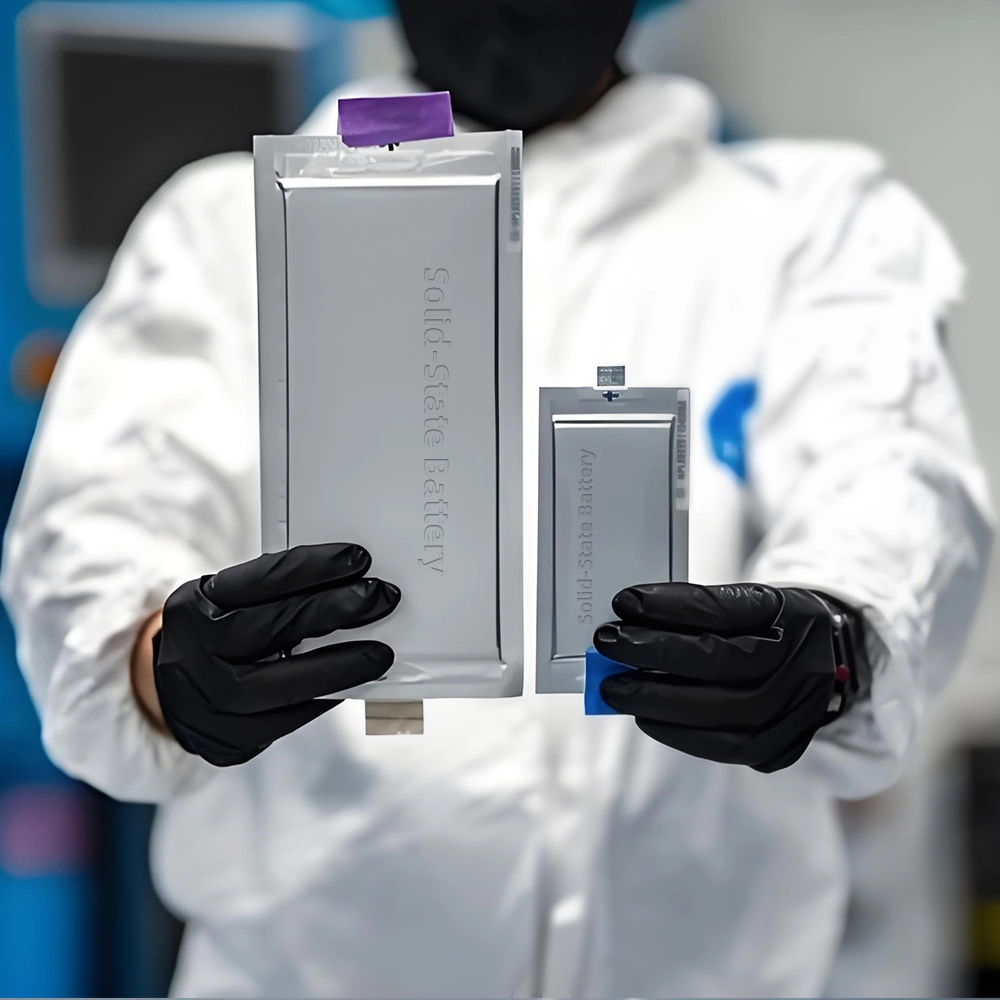
The lab focuses on solid-state battery research to overcome traditional lithium batteries' safety and energy density issues, supporting environmental sustainability. It develops innovative solid-state electrolytes, refines electrode materials, and investigates ion transfer and interface stability to revolutionize battery technology.

The electric vehicle battery industry is rapidly developing, focusing on technological innovation, market competition, and sustainability. Research hotspots include solid-state batteries, new types of electrolytes, BMS optimization, and recycling technologies. The environmental adaptability, safety, and economic viability of batteries are key research areas, and the industry is expected to undergo more innovation and transformation.

Specializing in battery preparation technology research, the focus is on overcoming existing energy storage challenges by innovating in electrode materials, battery chemistry, and manufacturing processes to improve performance, safety, and reduce costs. Sustainability and recycling technologies for batteries are also emphasized to mitigate environmental impacts and foster the growth of green energy.