Electron paramagnetic resonance (EPR) is a magnetic resonance technique originated from the magnetic moment of unpaired electrons. It can be used to detect the unpaired electrons contained in atoms or molecules from qualitative and quantitative aspects, and to explore the structural characteristics of their surrounding environment. For free radicals, the orbital magnetic moment has little effect, and the vast majority of the total magnetic moment (more than 99%) is contributed by the electron spin, so the electron paramagnetic resonance is also known as 'electron spin resonance' (ESR).
Although its physical principle is similar to nuclear magnetic resonance, EPR focuses on unpaired electrons rather than other nuclear spins such as protons. EPR is mainly used to detect free radicals, lattice defects, transition metal and rare earth metal ions and triplet molecules. It can also be used to detect the unpaired electrons contained in material atoms or molecules qualitatively and quantitatively, and to explore the structural characteristics of their surrounding environment.
Electron is a basic particle with a certain mass and negative charge, which can carry out two kinds of motion. One is to move around the orbit of the nucleus, and the other is to spin through the axis of its center.
Due to the movement of the electron, the torque is generated, and the current and magnetic moment are generated during the movement. In the external constant magnetic field H, the effect of the electron magnetic moment is like a small magnetic rod or magnetic needle. Because the spin quantum number of the electron is 1/2, the electron has only two orientations in the external magnetic field: one is parallel to H, corresponding to the low energy level, and the energy is −1/2gβH; it is parallel to the inverse of H, corresponding to the high energy level, the energy is +1/2gβH, and the energy difference between the two levels is gβH, which is called the Zeeman effect, as shown in Figure 1.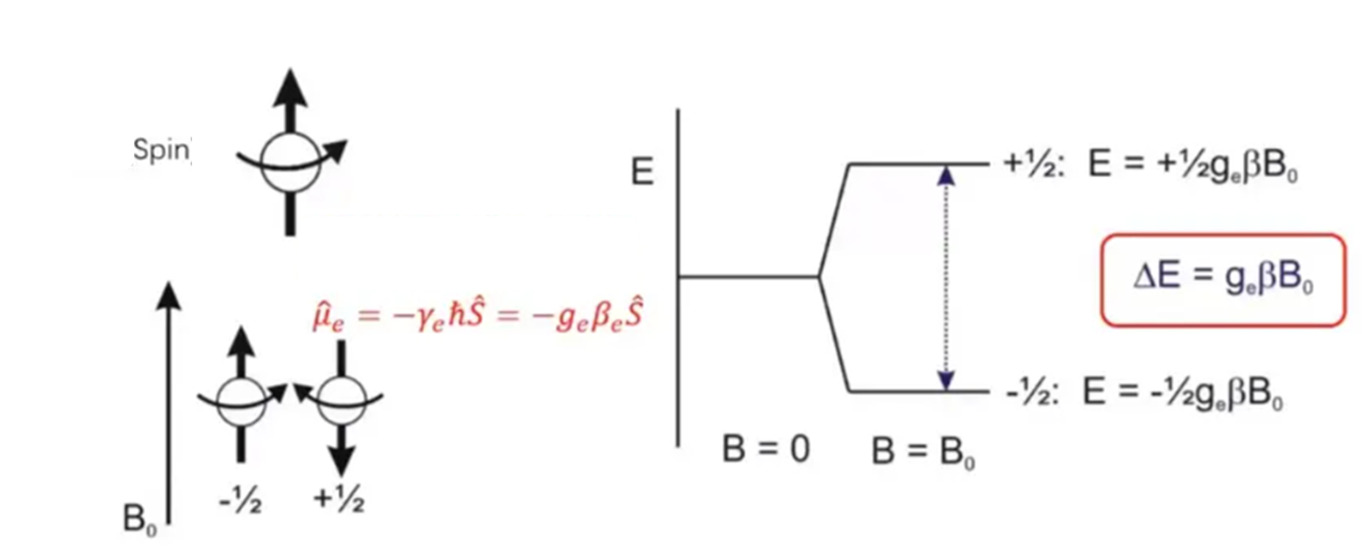
Figure 1 Zeeman effect of electron in static magnetic field
If the electromagnetic wave with a frequency of v is added in the direction perpendicular to H so that the condition hv=gβH(B) can be satisfied, the low-level electrons absorb the electromagnetic wave energy and transition to the high-level, which is called electron paramagnetic resonance, as shown in Figure 2.

Figure2 Resonance absorption diagram
In the above basic conditions for the generation of electron paramagnetic resonance, h is the Planck constant, g is the spectral splitting factor (referred to as g factor or g value), and β is the natural unit of the electronic magnetic moment, which is called Bohr magneton. Substituting the g value of free electrons=2.00232, β=9.2710×10⁻²¹ erg/Gauss, h=6.62620×10⁻²⁷ erg·s into the above formula, the relationship between the electromagnetic wave frequency and the resonant magnetic field can be obtained: (Gauss)=2.8025 (MHz).
Electron paramagnetic resonance spectrometer consists of four components : 1. microwave generation and conduction system; 2. resonant cavity system; 3. electromagnet system; 4. Modulation and detection system.
The main work flow of the spectrometer is as follows :
1.RF pulse: The nuclear magnetic resonance spectrometer excites the nuclei in the sample by applying a RF pulse to the sample. The frequency of this RF pulse is usually matched to the resonance frequency of a specific nucleus.
2.Determination of resonance frequency: By gradually increasing the intensity of the external magnetic field, the nucleus in the sample gradually reaches the resonance condition, so as to determine the resonance frequency of the nucleus.
3.Detection signal: When the atomic nuclei in the sample resonate, they will send a signal. This signal is captured by the detector and then converted into nuclear magnetic resonance spectroscopy.
4.Data processing: The captured signal is processed and converted into a nuclear magnetic resonance spectrum by mathematical methods such as Fourier transform, which contains information about different nuclei in the sample.
1.Free radicals: The molecule contains an unpaired electron substance, such as diphenyl picrylhydrazyl (DPPH), triphenylmethyl, and has an unpaired electron.
2.Biradical or Polyradical: compounds containing two or more unpaired electrons in a molecule, but their unpaired electrons are far away from each other and the interaction is weak.
3.Triplet molecule: The molecular orbital of this compound contains two unpaired electrons, which are very close to each other and have strong interaction with each other. Like oxygen molecules, they can be ground or excited states.
4.Transition metal ions and rare earth ions: These molecules appear unpaired electrons in the atomic orbital, such as common transition metal ions Ti3+ (3d1), V3+ (3d7) and so on.
5.Lattice defects in solids: One or more electrons or holes are trapped in or near the defects, forming a single-electron material, such as face center, body center, etc.
6. Atoms with odd electrons, such as hydrogen, nitrogen, alkali metal atoms.
EPR technology has been widely used in the following fields:
1.Direct detection and analysis of free radical intermediates: EPR detection of free radicals is a fast, direct and effective method. In the experiment, the g factor of the corresponding absorption peak in the obtained EPR spectrum is calculated. By comparing with the standard value, the free radical is estimated, and then the free radical is eliminated by chemical means to verify the above inference.
2.The EPR detection method and application of transient free radicals: The combination of free radical capture technology and EPR has the advantages of high detection sensitivity, strong specific selectivity and reliable analysis results. It is widely used in the detection of transient free radicals with short life and low steady-state concentration. It has been widely used in many studies involving cell and even animal systems and chemical reaction mechanisms. The experimental method of EPR detection of transient free radicals is as follows : Firstly, a probe molecule capable of capturing free radicals is designed and synthesized. This probe molecule must be able to quickly capture the transient free radicals generated during the reaction. Then, the molecular structure of the capture reaction adduct is analyzed by EPR. The structure of each peak on the EPR line is identified one by one to infer and identify.
3.Study on EPR spectrum of paramagnetic ion complexes: The EPR spectrum of paramagnetic ion complexes is to use paramagnetic metal ions as structural probes to combine with proteins and other organic substances to form coordination structures. By studying the EPR spectrum of paramagnetic ion complexes, important information such as the spin state, coordination structure and electronic energy level of the molecules of the complexes can be obtained. The analysis of EPR spectra of paramagnetic ions depends on the configuration of the complexes and the distribution of d electrons and defects. Through the study of theoretical calculation methods, the EPR signal characteristics and catalytic properties of various transition metal ions and their compounds under different coordination fields can be analyzed in depth.
4.Lattice defects in solids: One or more electrons or holes are trapped in or near the defects, forming a single-electron material, such as face center, body center, etc. Or atomic defects containing single electrons caused by the lack of atoms.
5.The application of electron paramagnetic resonance in industrial and agricultural production: electron paramagnetic resonance has many applications in actual industrial and agricultural production, including food and free radicals, quality control in beer brewing process, irradiation dosimeter, determination of archaeological age, detection of tobacco free radicals, prediction of optimal storage conditions of seeds and pollen, etc.
Part One: Introduction of EPR spectra
1. The composition of EPR spectrum:
The EPR spectrum consists of abscissa and ordinate (shown in Figure 3), where the abscissa has two expressions, magnetic field strength and g factor. The common units of magnetic field strength are mT and G, and the conversion relationship between them is 1 mT=10 G. The g factor is a dimensionless unit, also known as the fingerprint of paramagnetic material, which is commonly used in the valence state of vacancy/transition metal ions. The ordinate is the signal strength (Intensity), is any unit, commonly used a.u..
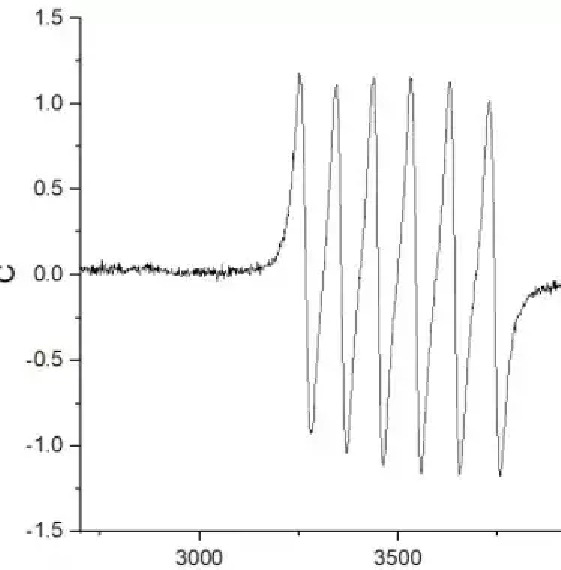
Figure 3 EPR spectra of metal Mn
2.1 line shape
As shown in Figure 4, the line shape of EPR is divided into Lorentz (upper part ) and Gauss (lower part). The corner of Lorentz curve presents a certain radian, and the corner of Gauss curve presents a similar right angle of 90 °.
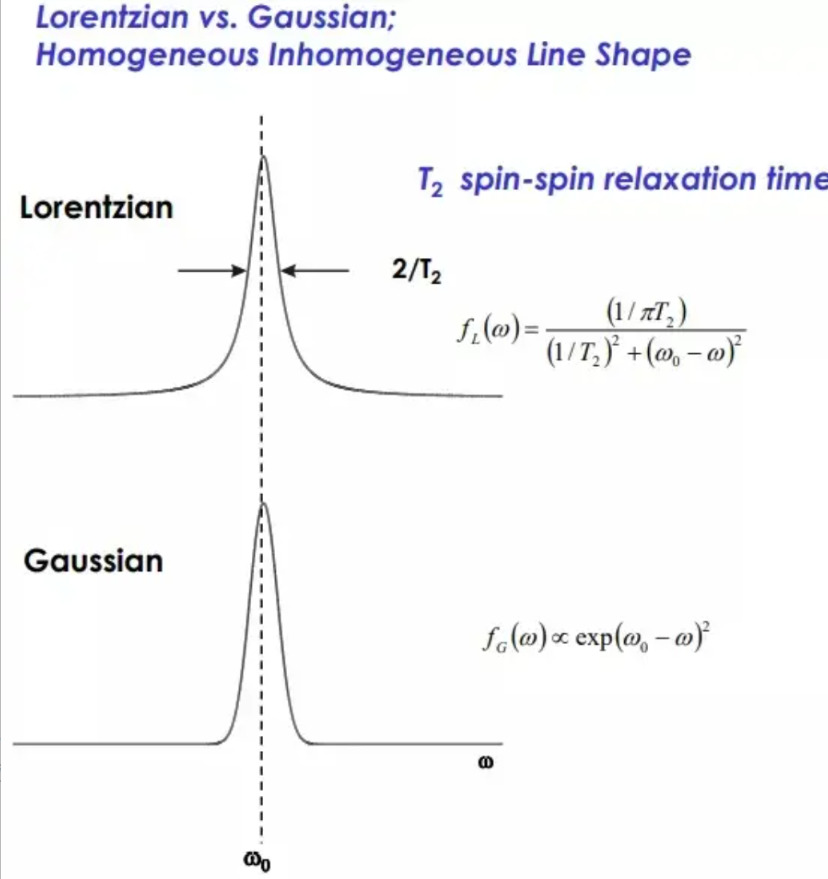
Figure 4 The Lorentzian and Gaussian lines of EPR spectra
As shown in Figure 5, the distance between the highest point and the lowest point of a peak is denoted by ∆H or ∆B. The distance between the two is the linewidth of the spectrum, and the unit is generally Gaussian (G) or mT.
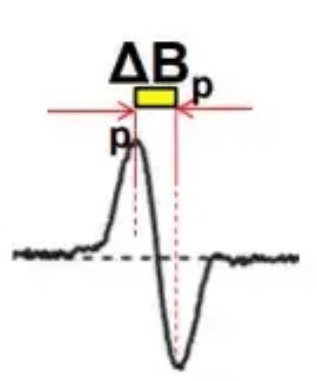
Figure 5 The line width of EPR spectrum
As shown in Figure 6, the g-factor of a single peak is the magnetic field corresponding to the center of the peak, the g-factor of a double peak is the magnetic field corresponding to the center of the two peaks, and the g-factor of a symmetrical multi-peak is the magnetic field corresponding to the center of the central peak.
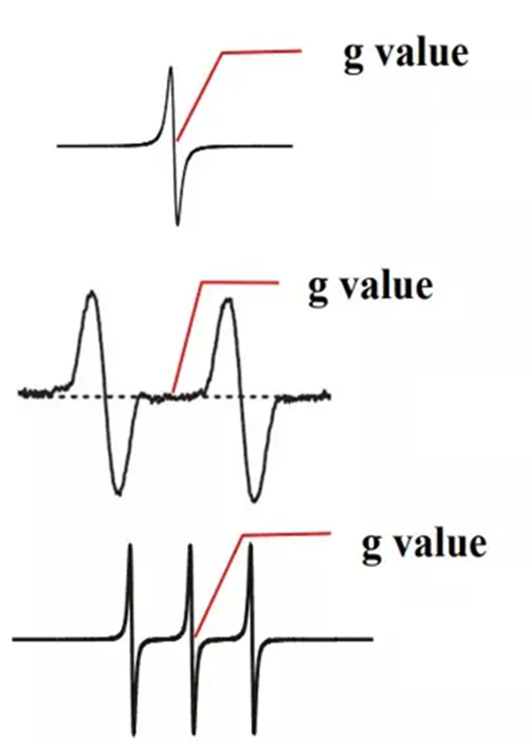
Figure 6 g-factor reading of EPR spectra
The following will mainly introduce the spectral analysis of several common free radicals and vacancies, such as the spectra of hydroxyl radicals, superoxide radicals, singlet oxygen and O, N, S vacancies.
The spectrum of free radicals mainly depends on the number and proportion of peaks, and the vacancy mainly depends on the value of g factor.
1. Hydroxyl radical (OH)
As shown in Figure 7, the hydroxyl radical is referred to as OH, with four peaks, from left to right, the ratio of peaks is 1 : 2 : 2 : 1.
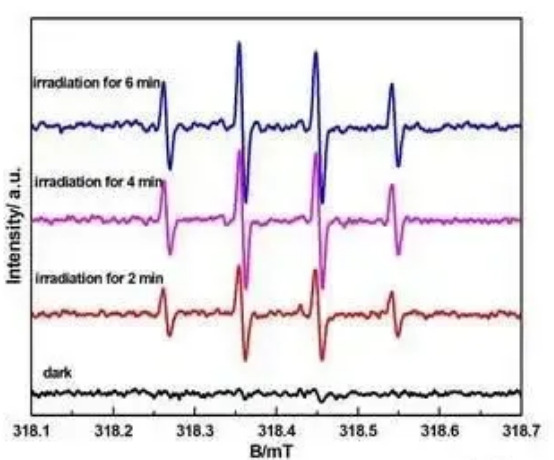
Figure 7 Spectra of hydroxyl radical
As shown in Figure 8, the superoxide radical is referred to as OO, with six peaks, from left to right, four large and two small (the peak intensity at 1,2,4,6 positions is almost the same, and the peak intensity at 3 and 5 positions is lower).
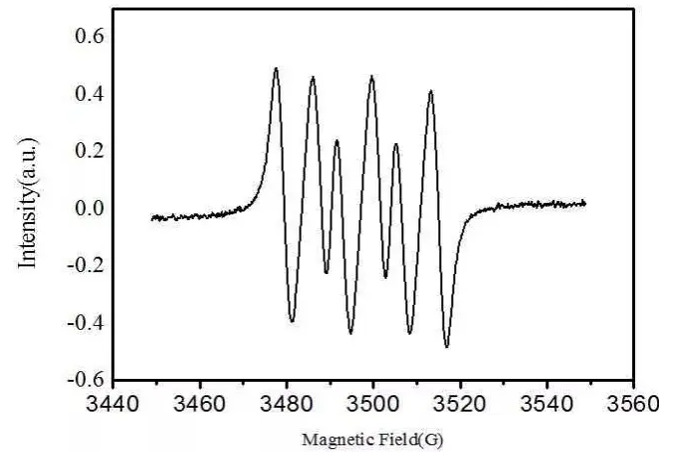
Figure 8 Spectra of superoxide radical
As shown in Figure 9, singlet oxygen is referred to as 1O2, with three peaks, from left to right, three equal heights, 1:1:1.
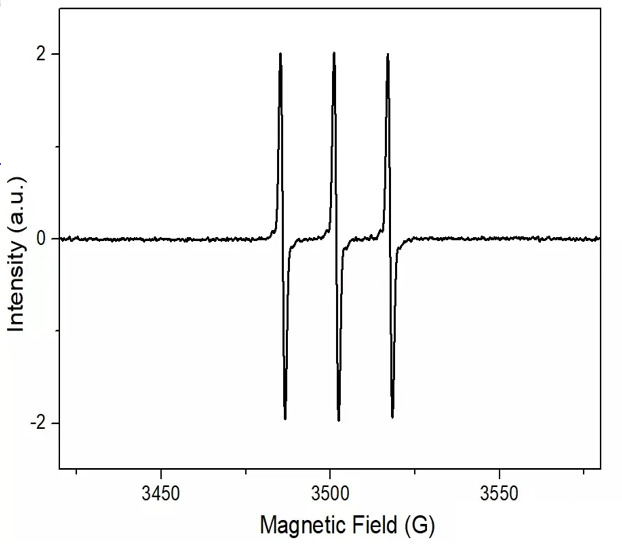
Figure 9 Spectra of singlet oxygen
4. Vacancy
As shown in Figure 10, the vacancy mainly depends on the value of the g factor. The common O vacancy is about 2.003, the S vacancy is about 2.004, and the N vacancy is about 2.005.
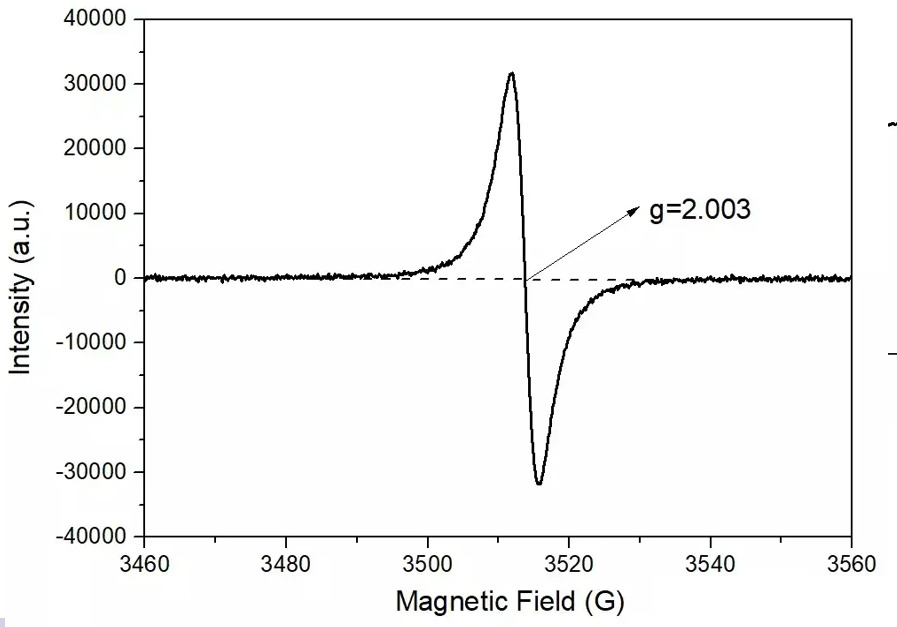
Figure 10 Spectra of vacancies


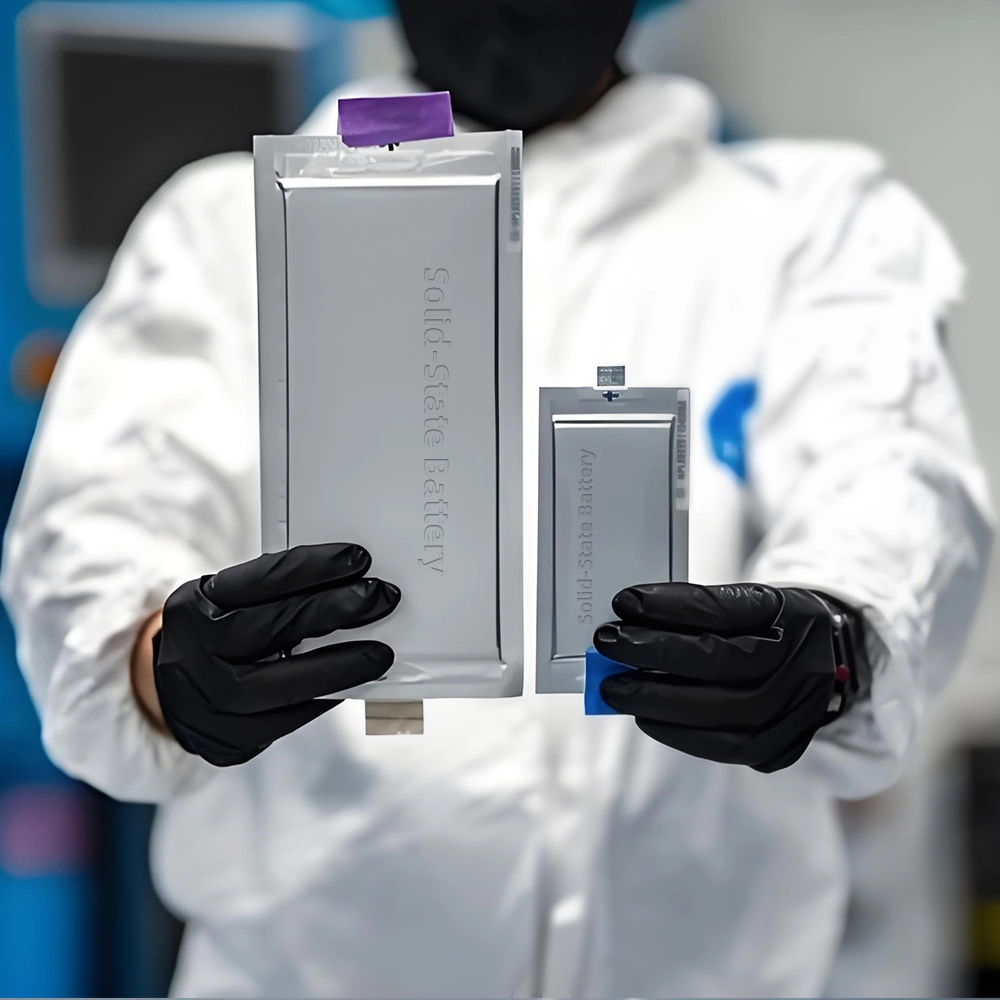
The lab focuses on solid-state battery research to overcome traditional lithium batteries' safety and energy density issues, supporting environmental sustainability. It develops innovative solid-state electrolytes, refines electrode materials, and investigates ion transfer and interface stability to revolutionize battery technology.

The electric vehicle battery industry is rapidly developing, focusing on technological innovation, market competition, and sustainability. Research hotspots include solid-state batteries, new types of electrolytes, BMS optimization, and recycling technologies. The environmental adaptability, safety, and economic viability of batteries are key research areas, and the industry is expected to undergo more innovation and transformation.
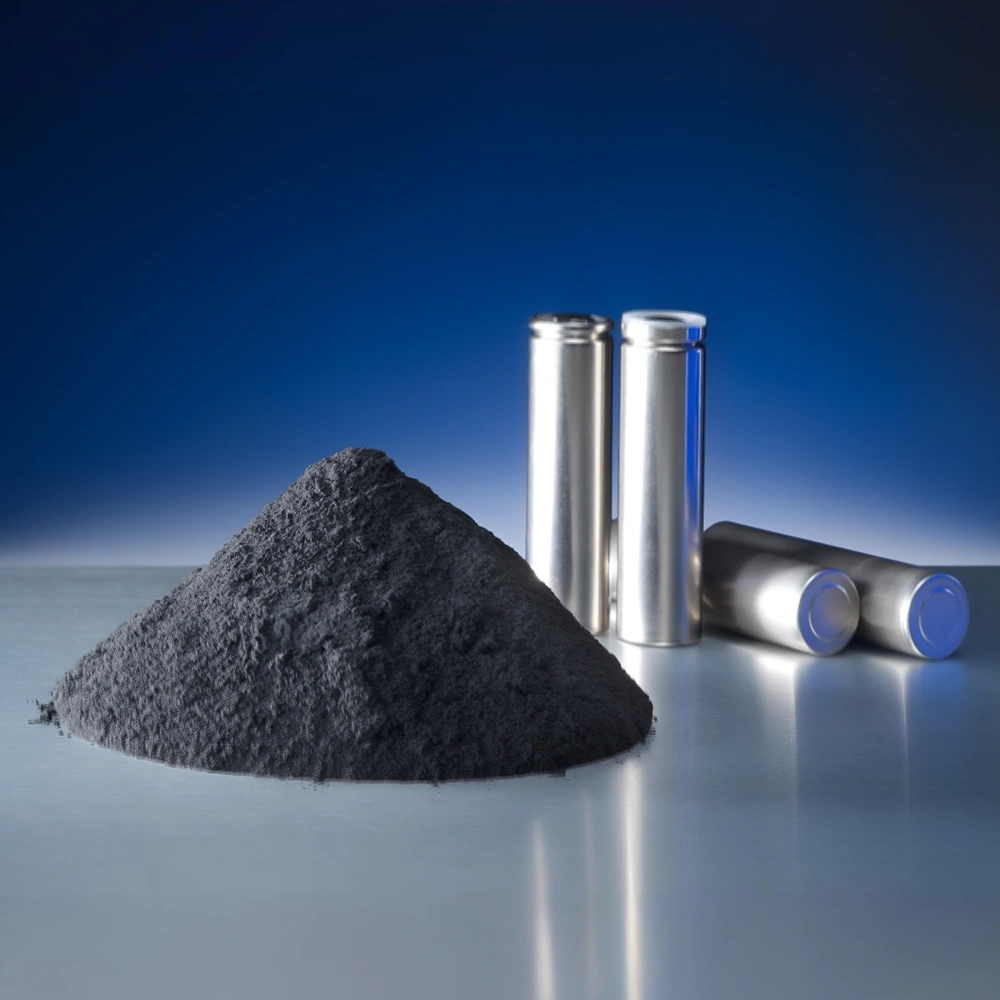
Specializing in battery preparation technology research, the focus is on overcoming existing energy storage challenges by innovating in electrode materials, battery chemistry, and manufacturing processes to improve performance, safety, and reduce costs. Sustainability and recycling technologies for batteries are also emphasized to mitigate environmental impacts and foster the growth of green energy.