Electrochemical Impedance Spectroscopy (EIS) is obtained by applying a small-amplitude sinusoidal potential (or current) perturbation signal to an electrochemical system and measuring the corresponding current (or potential) response generated by the system, thus obtaining an impedance spectrogram. This spectrogram reflects the variation relationship of the impedance of the electrochemical system with frequency and provides rich information about the interfacial structure and kinetics.

It's principle can be intuitively obtained from the above figure: A small-amplitude sinusoidal potential signal is generated by a waveform generator and then applied to the electrochemical system through a potentiostat. The output potential/current signal is converted, and finally, a lock-in amplifier and a spectrum analyzer are used to output the relationships such as impedance modulus, phase angle ~ frequency (the frequency of the sine wave is constantly changing). Among them, the frequency range can be set according to the requirements of the measured sample (the range can reach 1,000,000 Hz (or higher) ~ 0.01 Hz (or lower)). Therefore, compared with other electrochemical testing methods, EIS (Electrochemical Impedance Spectroscopy) can obtain more information about electrochemical kinetics and the electrode interface.
The electrochemical system is regarded as an equivalent circuit composed of basic components such as resistors (R), capacitors (C), inductors (L), etc., which are connected in series or in parallel. Through Electrochemical Impedance Spectroscopy (EIS), the magnitudes of these components can be quantitatively determined. By utilizing the electrochemical meanings of these components, the structure of the electrochemical system and the nature of the electrode process can be analyzed.
EIS obtains the relationship between the impedance or admittance of an electrochemical system and frequency by measuring these response signals. Impedance and admittance are complex numbers, which contain real and imaginary parts, corresponding respectively to the resistance and capacitance (or inductance) characteristics of the electrochemical system. These complex data can be plotted into impedance spectrograms or admittance spectrograms, intuitively showing the variation laws of the impedance or admittance of the electrochemical system with frequency.
")
We can regard an electrochemical system with an unknown internal structure as a black box. By inputting a perturbation function (or excitation function) into it, the system will correspondingly output a response signal. The function that describes the relationship between this perturbation and the response is called the transfer function, which reflects the internal structural characteristics of the system. Through the study of the transfer function, we can gain an in-depth understanding of the properties and internal structure of the system. Especially when the internal structure of the system is linear and stable, there will be a linear relationship between the output signal and the perturbation signal, which provides convenience for our analysis.
The difference in the input signal endows G(ω) with different meanings. In the formula Y/X = G(ω), X represents the input perturbation signal, Y is the corresponding output signal, and G is the result of the relationship between the two, and their frequencies are all ω. When X represents the current and Y represents the potential, G(ω) is defined as impedance, denoted by Z; conversely, when X is the potential and Y is the current, G(ω) is defined as admittance, denoted by Y. It should be noted that impedance and admittance are reciprocal to each other, and they jointly form the concept of immittance, denoted by G.
Immittance is a vector that changes with the angular frequency ω and is usually represented by a complex function of the angular frequency ω (or the general frequency f). This complex function is generally written as Z = Z' + jZ", where Z' represents the real part and Z" is the imaginary part.
The following is a typical complex function diagram, which can more intuitively show the variation law of immittance.


The Nyquist plot is also known as the complex plane plot. It takes the real part of the impedance as the horizontal axis and the negative value of the imaginary part as the vertical axis. Each point in the graph corresponds to a different frequency. The left side is the high-frequency region, and the right side is the low-frequency region.
The Bode plot is a method for representing the characteristics of the electrochemical impedance spectrum. It includes two curves. The horizontal axis is the logarithm of the frequency, and the vertical axis is the logarithm of the impedance modulus value. The other curve is the phase angle of the impedance. The impedance of the electrochemical system can be analyzed by using either the Nyquist plot or the Bode plot, and thus relevant electrochemical information can be obtained.
1. Causality: Ensure that there is a unique causal relationship between the excitation signal and the response signal.
2. Linearity: Ensure that the excitation signal and the response signal have an approximately linear relationship, and the amplitude of the sinusoidal excitation signal must be small enough.
3. Stability: Ensure that the excitation signal will not change the internal structure of the electrochemical system. Otherwise, the response signal cannot reflect the real electrode reaction process.
Of course, a certain amount of knowledge about complex numbers and electrical engineering is required to truly understand the principle of EIS.
Its advantage lies in its quasi-steady-state method and simplified calculation. Since a small-amplitude sinusoidal potential signal is used to perturb the system, when measuring near the equilibrium potential, the anodic and cathodic processes on the electrode will alternately occur and cancel each other out, thus avoiding the accumulative development of the polarization phenomenon and the damage to the state of the electrode surface. This makes the EIS method a quasi-steady-state method, which simplifies the mathematical processing procedure. At the same time, due to its measurement capability over a wide frequency range, EIS can provide more kinetic information and information about the electrode interface structure than conventional methods.
When disassembling the equivalent circuit, we first need to understand the representation forms of each basic component in the Nyquist plot. The resistance is represented as a point on the horizontal axis in the Nyquist plot; the capacitor is represented as a straight line coinciding with the vertical axis; while the series or parallel circuit of the resistor R and the capacitor C is respectively represented as a straight line intersecting the horizontal axis at R and parallel to the vertical axis, and a semi-circle with a radius of R/2.
Firstly, the charge transfer resistance is connected in parallel with the double-layer capacitance at the electrode-solution interface. Subsequently, this parallel circuit is then connected in series with the ohmic resistance. It should be noted that the ohmic resistance not only includes the resistance of the solution in the measurement circuit but may also involve the solution resistance between the working electrode and the reference electrode or in a two-electrode battery.

If we further derive the formula, we will obtain an equation that describes the equivalent circuit. The corresponding graph is a circle with the center at \((R_{\Omega}+R_{ct}/2, 0)\) and the radius of \(R_{ct}/2\), as specifically shown in the following figure.

From the Nyquist plot, we can directly read out the values of Rω and Rct, where Zre=RΩ+Rct/2. In addition, through the ω value at the vertex of the semi-circle, we can further calculate Cd, and the calculation formula is Cd=1/(ωR).
However, in the actual EIS measurement of solid electrodes, we find that the curve often deviates from the semi-circular trajectory and appears as an arc segment, which is called the capacitive reactance arc. This phenomenon is called the "dispersion effect", and the reasons for its occurrence are not yet fully understood. But it is generally believed to be related to factors such as the inhomogeneity of the electrode surface, the adsorption layer on the electrode surface, and the poor conductivity of the solution. It reveals the characteristics that the electrode double layer deviates from the ideal capacitor, that is, simply equivalent the double layer at the electrode interface to a physically pure capacitor is not accurate enough.
At the same time, in order to reduce the influence of the dispersion effect, some measures need to be taken during the measurement process. For example, optimizing the preparation process of the electrode to improve the uniformity and smoothness of the electrode surface; selecting an appropriate electrolyte solution and concentration to reduce the influence of ionic conductivity and concentration distribution on the dispersion effect; using high-precision measurement equipment and methods to reduce the interference of noise and errors on the shape of the impedance spectrum.
If the charge transfer kinetics is not very fast, and the charge transfer process and the diffusion process jointly control the overall electrode process, with both electrochemical polarization and concentration polarization existing simultaneously, then the equivalent circuit of the electrochemical system can be simply expressed as:

On the Nyquist plot, the diffusion control is manifested as a straight line with an inclination angle of π/4 (45°).

When the electrode process is jointly controlled by the charge transfer process and the diffusion process, within the entire frequency domain, its Nyquist plot is composed of a semi-circle in the high-frequency region and a straight line at an angle of 45 degrees in the low-frequency region. The high-frequency region is controlled by the electrode reaction kinetics (charge transfer process), and the low-frequency region is controlled by the diffusion of reactants or products in the electrode reaction. The straight line of the diffusion impedance may deviate from 45°.

The reasons are as follows: the electrode surface is very rough, so that part of the diffusion process is equivalent to spherical diffusion; in addition to the electrode potential, there is another state variable, and this variable causes inductive reactance during the measurement process.
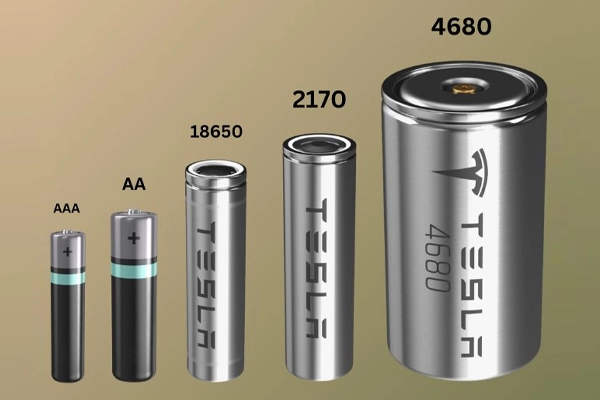
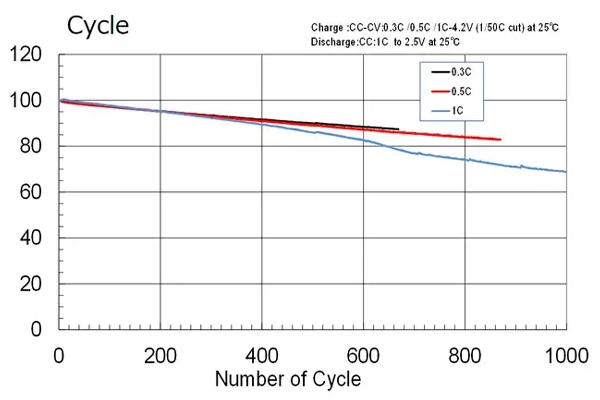
AC impedance testing has a wide range of applications in the field of batteries such as lithium batteries. It can help scientific researchers more conveniently obtain the internal information of batteries, including the impedance of various parts of the battery (total impedance, interface impedance, diffusion impedance, etc.), so as to carry out targeted improvements and failure analyses of the battery system.


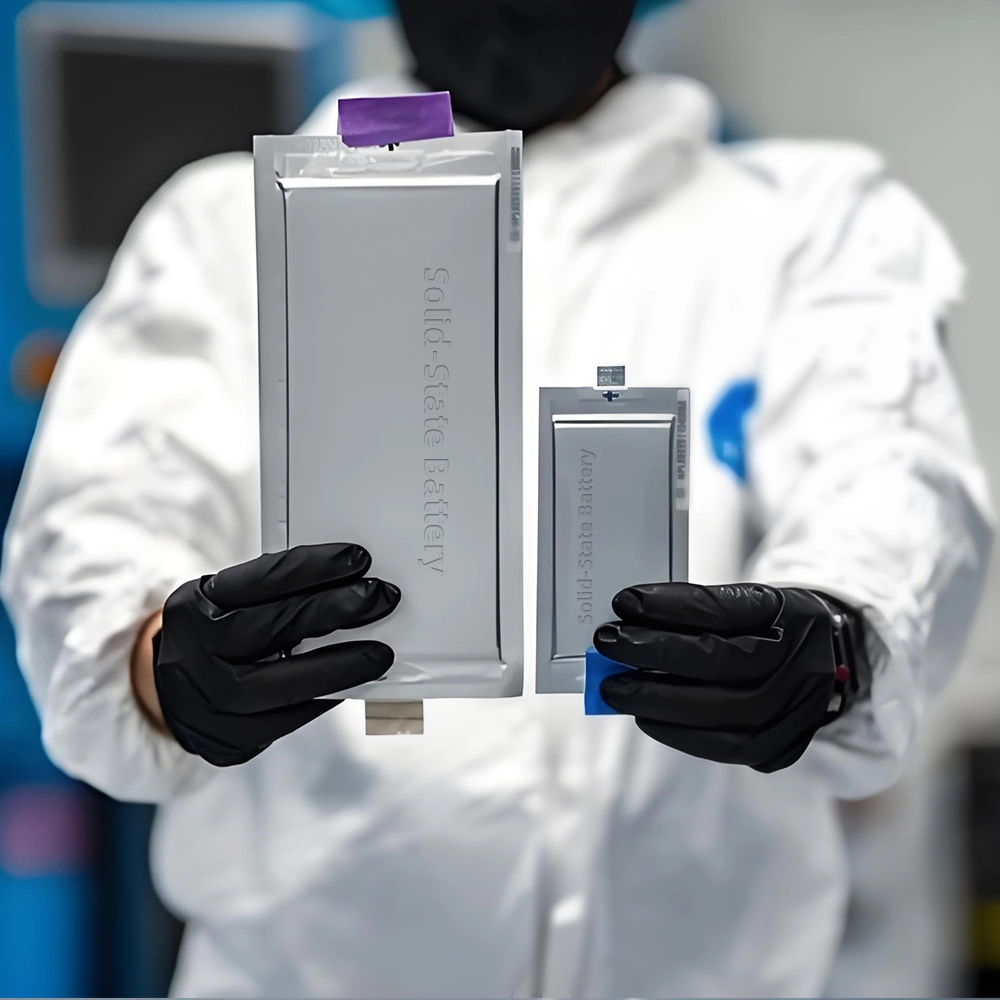
The lab focuses on solid-state battery research to overcome traditional lithium batteries' safety and energy density issues, supporting environmental sustainability. It develops innovative solid-state electrolytes, refines electrode materials, and investigates ion transfer and interface stability to revolutionize battery technology.

The electric vehicle battery industry is rapidly developing, focusing on technological innovation, market competition, and sustainability. Research hotspots include solid-state batteries, new types of electrolytes, BMS optimization, and recycling technologies. The environmental adaptability, safety, and economic viability of batteries are key research areas, and the industry is expected to undergo more innovation and transformation.

Specializing in battery preparation technology research, the focus is on overcoming existing energy storage challenges by innovating in electrode materials, battery chemistry, and manufacturing processes to improve performance, safety, and reduce costs. Sustainability and recycling technologies for batteries are also emphasized to mitigate environmental impacts and foster the growth of green energy.
