X-ray Photoelectron Spectroscopy (XPS) is a powerful surface analysis technique widely used in materials science and chemical research. XPS not only provides qualitative and quantitative analysis of elements but also offers information on chemical states through high-resolution spectra. In lithium-ion battery research, XPS high-resolution spectra are used to analyze the surface chemical states of electrode materials and the formation of the solid electrolyte interphase (SEI). This article will detail the principles of XPS high-resolution spectra, methods of interpretation, and their importance in practical applications.
XPS high-resolution spectra refer to more detailed spectral graphs obtained by measuring the binding energy of photoelectrons with high resolution. High-resolution spectra can resolve small differences in the binding energy of the same element under different chemical environments, thus providing information about the chemical state of elements.
Binding energy: The binding energy of photoelectrons is a characteristic fingerprint of elements. By measuring the binding energy, one can identify elements and their chemical states.
Chemical shift: The binding energy of the same element can exhibit slight changes in different chemical environments, known as chemical shifts. Chemical shifts reflect the bonding state and charge distribution of elements with surrounding atoms.
In high-resolution spectra, the binding energy peaks of elements in different chemical states can overlap. Peak separation and fitting can resolve the position, intensity, and width of each component peak. Gaussian-Lorentzian mixed functions are typically used for peak fitting to obtain more precise peak parameters.
Peak separation: This involves decomposing overlapping peaks in complex spectra to clarify their respective contributions. This step is particularly important for multi-element, multi-chemical state samples. Common peak separation methods include:
Background subtraction: XPS spectra contain background signals, which are usually removed using methods such as Shirley background or linear background subtraction to eliminate the interference of the background on the peaks. Accurate background subtraction can improve the precision of peak separation.
Initial peak identification: Major peak positions in the spectra are determined through visual inspection or automatic peak identification algorithms. This step helps identify individual peaks in the spectra and provides initial parameters for subsequent peak fitting.
Multi-Peak fitting: Mathematical functions (e.g., Gaussian, Lorentzian, or their combinations) are used to fit each peak, separating overlapping peaks. Multi-peak fitting can be optimized using nonlinear least squares to achieve the best fit.
Peak fitting involves mathematical modeling of the separated peaks to accurately describe their shapes and positions. Common peak fitting methods include:
Gaussian fitting: Suitable for describing symmetric peaks, typically applied to thermodynamically stable simple chemical states.
Gaussian function form:

Where I0 is the peak intensity, E0 is the peak position, σ and is the peak width.
Lorentzian fitting: Suitable for describing peaks broadened by energy loss mechanisms, typically applied to metals or strongly coupled systems.
Lorentzian function form:

Where Г is the peak width, and other symbols are as described above.
Gaussian-Lorentzian fitting: The combination of Gaussian and Lorentzian functions (e.g., Voigt function) is suitable for describing complex peak shapes in actual spectra.
Voigt function form:

Where G(E') is the Gaussian function, and L(E) is the Lorentzian function.
Chemical shift refers to the change in the binding energy of an element due to changes in its chemical environment. In XPS, different chemical states cause changes in electron binding energy, resulting in different peak positions on the spectra. This change in peak position is the chemical shift. Changes in binding energy can reflect the chemical state of the element. For example, the binding energy of a metal element is lower than that of its oxide state. By analyzing chemical shifts, one can determine the oxidation state and coordination environment of an element. The magnitude of the chemical shift can also reflect information about bond energy, bond length, and charge distribution, aiding in understanding the chemical properties of materials.Causes of Chemical Shift:
Charge transfer: When atoms form chemical bonds, charge transfer occurs. For example, in oxides, the metal atom exhibits a positive chemical shift due to the loss of electrons.
Shielding effect: The rearrangement of the electron cloud can change the shielding effect of the nuclear charge on inner electrons, thereby affecting the binding energy. For example, an increase in electron density can reduce the binding energy, resulting in a negative chemical shift.
Lattice distortion: Lattice distortion in materials can also affect the binding energy, causing chemical shifts. For example, the distortion or defects in crystal structures can lead to changes in binding energy.
The width of XPS peaks is usually characterized by the Full Width at Half Maximum (FWHM). FWHM refers to the width of the photoelectron spectrum peak at half of its maximum height. Peak width is influenced by various factors, including instrument resolution, the nature of the sample, and external environmental factors. The chemical composition of the sample, structural defects, and crystal distortion can all affect the width of XPS peaks. For example, changes in the type of chemical bonds and bonding environment can lead to variations in peak width. The broader the distribution of chemical states, the wider the peak. Additionally, defects and lattice distortions in the sample can also cause peak broadening. FWHM reflects information about the chemical state and crystal defects of the element. A broader peak usually indicates the presence of multiple chemical environments or non-uniform chemical states in the sample.
Graphitic materials (e.g., graphite, graphene, carbon nanotubes) in X-ray Photoelectron Spectroscopy (XPS) typically have a main C 1s peak attributed to C=C bonds, which can be used as a charge reference set to 284.5 eV [1].
Table 1. General fitting parameters for graphitic/graphene/carbon nanotube type materials.

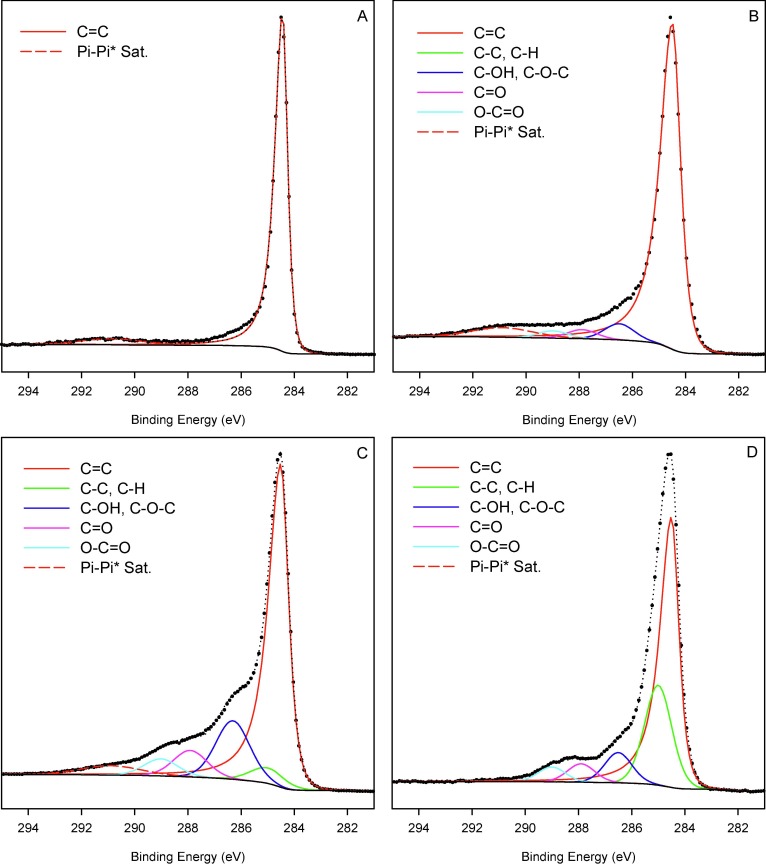
Figure 1 C1s High-Resolution Spectrum [2]
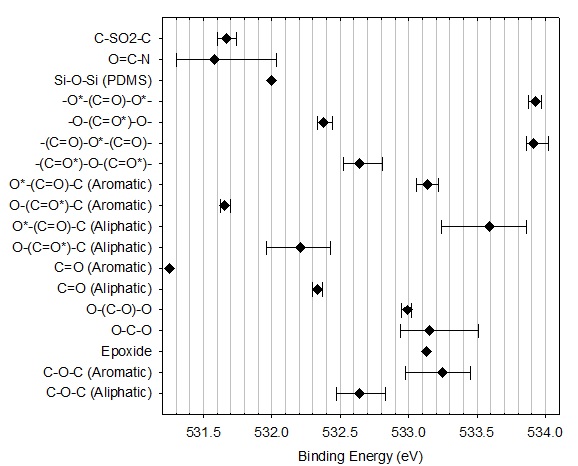
Figure 2 Average and range of oxygen 1s binding energy in various types of organic compounds [3]
Additional notes:
C-OH (aliphatic): average 532.9 eV, minimum 532.7 eV, maximum 533.1 eV
C-OH (aromatic): 533.6 eV
Also note that PDMS's Si 2p3/2 is 101.79 eV (Si 2p = 102.0 eV), C 1s is 284.38 eV, and O 1s is 532.00 eV. If we shift C 1s to 285.0 eV, then the Si 2p3/2 of silica gel is 102.41 eV (Si 2p = 102.6 eV), and O 1s is 532.62 eV.
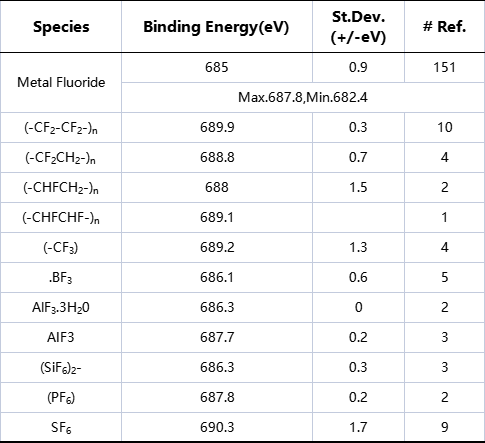
Figure 3 Average and range of F 1s binding energy
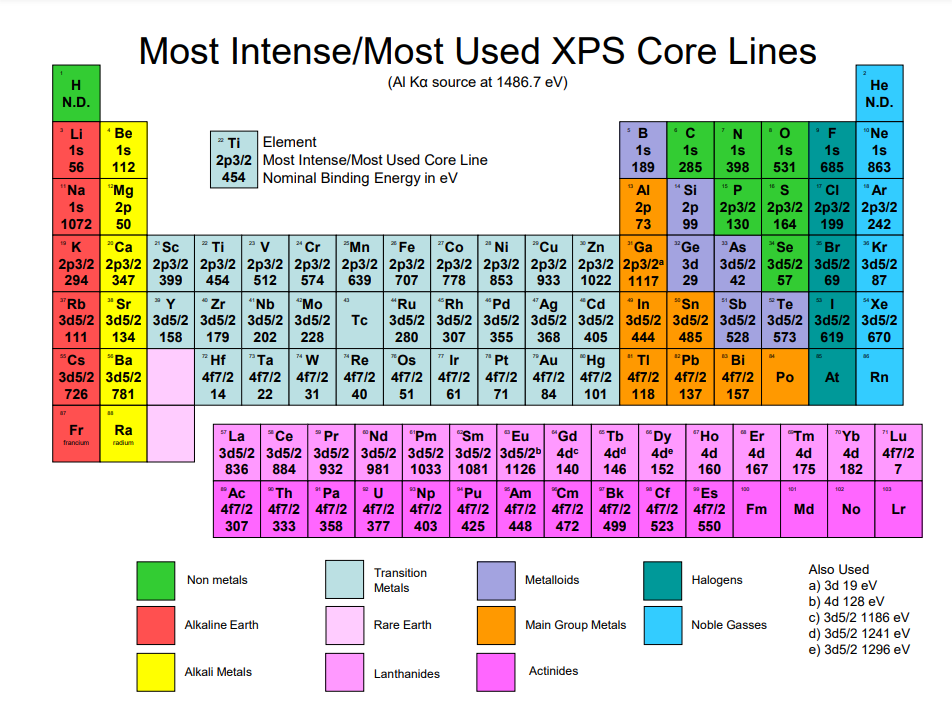
In X-ray Photoelectron Spectroscopy (XPS) analysis, most elements produce multiple peaks. Therefore, having a table listing the strongest or most commonly used peaks in XPS analysis is very useful, providing a good starting point for analysis.
Relationship between Binding Energy and Atomic Number: An obvious and important phenomenon shown in the table is that for a given orbital, the binding energy of peaks always increases with the increase of the atomic number (Z). This is an expected result because, according to Coulomb's law, the more protons in the nucleus, the stronger the binding force between electrons and atoms. Additionally, from a practical application perspective, all peak energy binding energies listed in the table are less than 1200 eV. This selection allows analysts to use Al Kα (1487 eV) and Mg Kα (1254 eV) X-rays for analysis, meaning this table is particularly suitable for those conducting conventional XPS analyses.
Auxiliary analytical thinking: It allows analysts to remember the optimal peaks for each element when using XPS to analyze certain elements regularly, without needing to understand how the preferred peaks of different elements relate to each other. The periodic table shows that the most commonly used peaks in XPS analysis are not randomly selected from the possible signals generated by atoms. In fact, elements with similar atomic numbers usually have the same recommended or preferred peaks.
Element peak recommendations: For example, starting from lithium, the first element to produce an XPS signal, the 1s orbital generates the best signal for analyzing all subsequent elements up to sodium (Na). Then, from magnesium (Mg) to silicon (Si), the most used peak becomes the 2p orbital signal. From phosphorus (P) to sulfur (S), the 2s orbital generates the best signal. This pattern continues and may be useful for your memory.
Determining sensitivity factors (SFs): For practical analysis, determining SFs for each element's peaks is a time-consuming but essential step. This table allows you to quickly and easily determine the SFs of commonly used peaks without needing to calculate the sensitivity of the main peaks of each element. The SF value may vary slightly depending on the specific XPS instrument used. Therefore, SFs must be accurately determined for each instrument. Once you have this table, if you change instruments or labs, you can quickly calibrate the SFs of each element using standards.
Provides information on the chemical state of elements
High resolution can resolve overlapping peaks
Suitable for surface and interface analysis
Requires complex peak separation and fitting processes
Analysis needs experience and professional knowledge
High-resolution XPS spectra are a powerful tool for chemical state analysis. Through high-resolution measurements and fine spectra analysis, it provides detailed information about the chemical environment and states of elements. High-resolution spectra play a crucial role in catalyst research, lithium-ion batteries, and semiconductor materials, helping researchers reveal the chemical properties of material surfaces and interfaces.
[1] C.D. Wagner, A.V. Naumkin, A. Kraut-Vass, J.W. Allison, C.J. Powell, J.R.Jr. Rumble, NIST Standard Reference Database 20, Version 3.4 (web version) (http:/srdata.nist.gov/xps/) 2003.
[2] M.C. Biesinger, Appl. Surf. Sci. 597 (2022) 153681.
[3] G. Beamson, D. Briggs, High Resolution XPS of Organic Polymers - The Scienta ESCA300 Database, Wiley Interscience, 1992, Appendices 3.1 and 3.2.


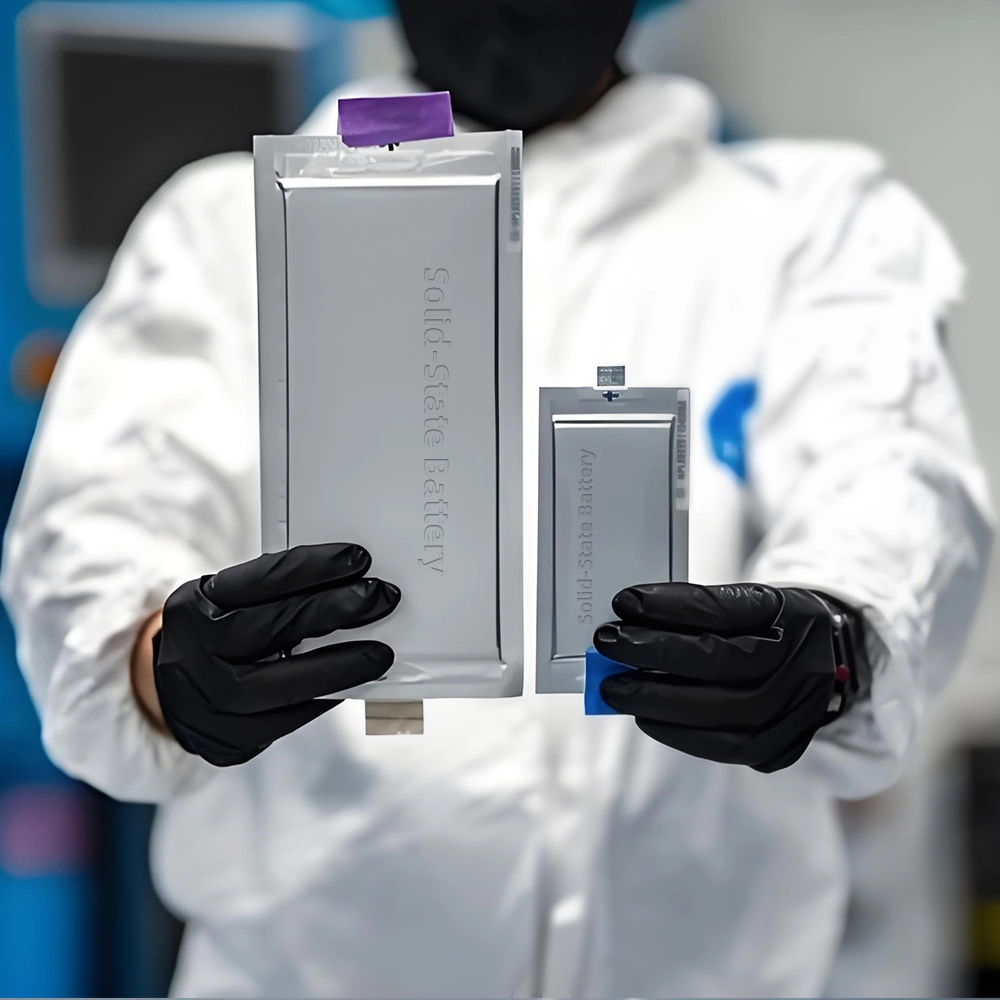
The lab focuses on solid-state battery research to overcome traditional lithium batteries' safety and energy density issues, supporting environmental sustainability. It develops innovative solid-state electrolytes, refines electrode materials, and investigates ion transfer and interface stability to revolutionize battery technology.

The electric vehicle battery industry is rapidly developing, focusing on technological innovation, market competition, and sustainability. Research hotspots include solid-state batteries, new types of electrolytes, BMS optimization, and recycling technologies. The environmental adaptability, safety, and economic viability of batteries are key research areas, and the industry is expected to undergo more innovation and transformation.

Specializing in battery preparation technology research, the focus is on overcoming existing energy storage challenges by innovating in electrode materials, battery chemistry, and manufacturing processes to improve performance, safety, and reduce costs. Sustainability and recycling technologies for batteries are also emphasized to mitigate environmental impacts and foster the growth of green energy.