Open a test data file, and the display will show the Total Time - Voltage & Current & Capacity curve. Right-click on the curve name to access the Curve settings, where you can set the graphical display data according to your needs, that is, the content of the X and Y axes.Below, set the curve name and background color, and click "Add curve" to complete.
When the mouse is placed over the numerical position of the axis, two functions will be displayed: when the mouse shows a line, click and slide up and down to stretch the axis accordingly; 鼠标显示上下箭头点击上下滑动,曲线整体进行上下移动。when the mouse shows up and down arrows, click and slide to move the curve up and down as a whole.
Double-click the axis to open the axis settings. Select the axis you want to change, and then you can modify the unit of the axis, the range of displayed data, the size and thickness of the primary and secondary ticks, and the color of the axis and curves. For example, in the total time-voltage curve shown, double-click the axis, change the voltage unit to V, set the minimum value to 2.49, the maximum value to 2.57, change the color to green, check "Title display in the axis," and click "OK." The axis will be changed accordingly, and the title will be displayed next to the axis.
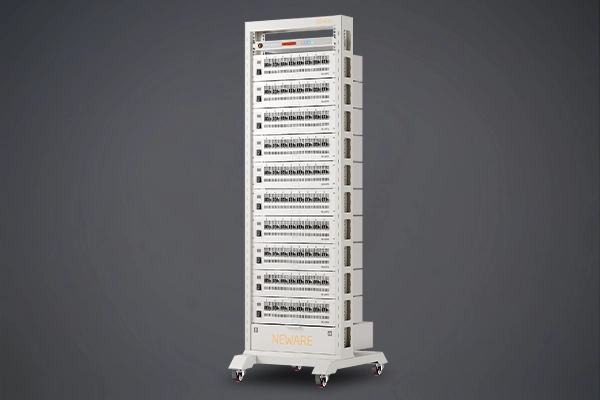
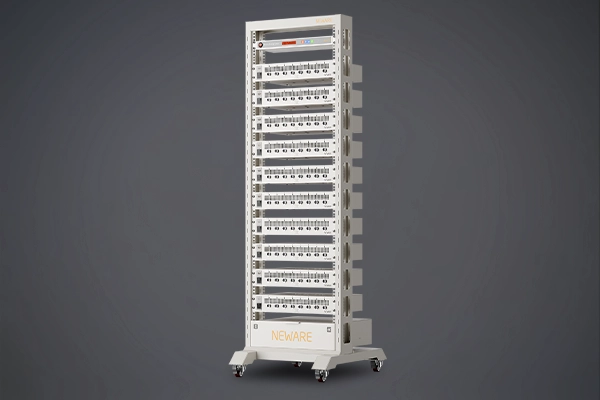
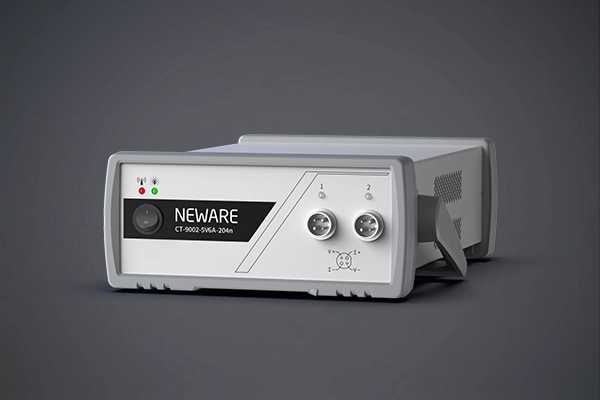
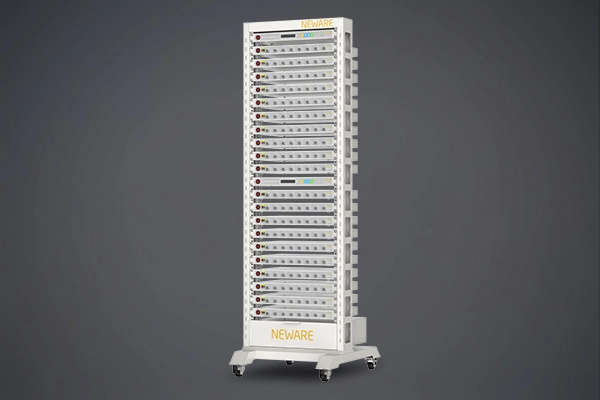
This operation video tutorial is applicable to the following products:
● CT-4000 Battery Testing System Series (CT-4008Q-5V100mA, CT-4008Q-5V6A-S1, CT-4008Q-5V6A-164, CT-4008Q-5V12A-S1, CT-4008Q-5V12A-164, etc.)
● CE-6000 Battery Testing System Series (Cell, Module, Pack, etc.)
● CT/CTE-8000 Battery Testing System Series (CT-8002Q-5V100mA, CTE-8008-5V200A, etc.)
● All-in-One Battery Testing System Series (WHW-25L-S-16CH, WIHW-200-160CH-B, WHW-100L-2-160CH, WHW-500L-5V6A80CH-380V, WGDW-380L-2-40BFC-5V600A8CH, etc.)

