BTSDA software is utilized for reviewing test data and performing calculations for GITT and DCIR data, with tools at the top of the graph for user convenience.
● Hand tool: Drags the· graph.
● Arrow tool: Double-click a point to view specific values in the data panel.
● Zoom in: Select an area for local magnification.
● Zoon tool: Scroll up and down to zoom in and out; mouse wheel can achieve the same effect.
● Ploy restore: Restores the graph to its initial state with one click.
● Graph copy: Outputs the current graph as an image for direct paste in documents.
● Undo/Restore: Reverses or reinstates the previous command.
● Curve comparison: Add multiple data sets by clicking "+" for cycle, step, and overall comparisons. Modify curve content for other data comparisons, such as Total Time-Voltage curve comparison.
● Data filter: Filters out voltage spikes due to various reasons during actual testing. By applying data filtering to remove these outliers, a smoother curve can be obtained. Select data filtering tool, set conditions, save path, and file name, check "Delete abnormal voltage points", and confirm to complete filtering and save the data file separately.


● Open file / Save As: For opening multiple data windows or saving data files.
● Parameter settings: Customize units, cycle layers, step layers, and record layers. Search "BTSDA Parameter Settings" for detailed instructions.
● Dividing line moves to the left/right: The interface has a divider between the graph and data. Click to move left to display data, or right to show the graph. Divider can also be moved with the mouse.
● Previous/Next channel: Not available for direct ndax file opening. Use in BTS software to view data from another channel.
● Refresh: View real-time data during testing. Click to display the latest results.
● Cycle layer/Step layer/Record layer Expand/Collapse : Data on the right is divided into cycle, step, and record layers. Use expand/collapse tools to view data at different levels.
● Export report/Multi-channel customize report: Export various report types like layered, formation, and custom reports. Search for "Reports" or "Export Reports and Multi-Channel Custom Reports" for video tutorials.
● DCIR/GITT: Calculate DCIR and GITT. Set conditions in DCIR for automatic calculation. In GITT, select the formula, input parameters, and it will automatically calculate the diffusion coefficient and display the graph. Export results by copying data or exporting reports. Search "DCIR" or "GITT" for detailed parameter settings.
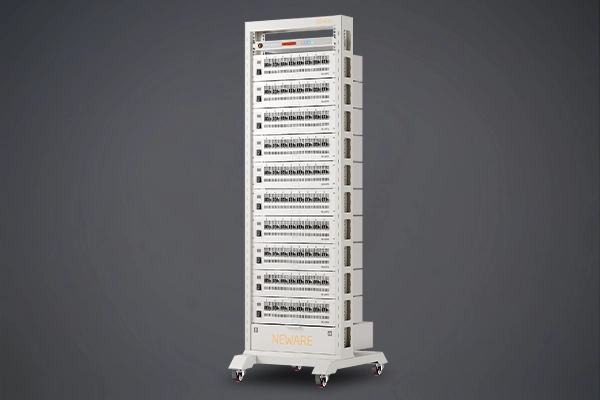
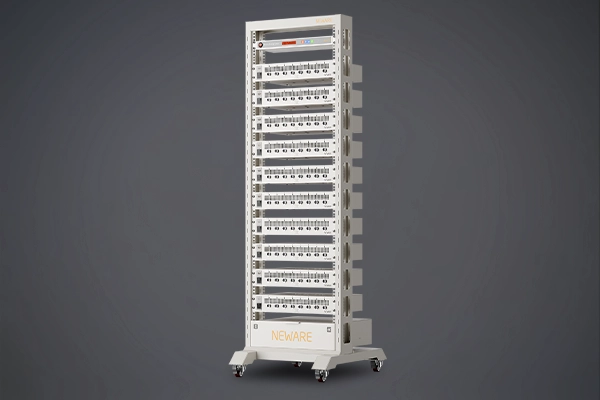
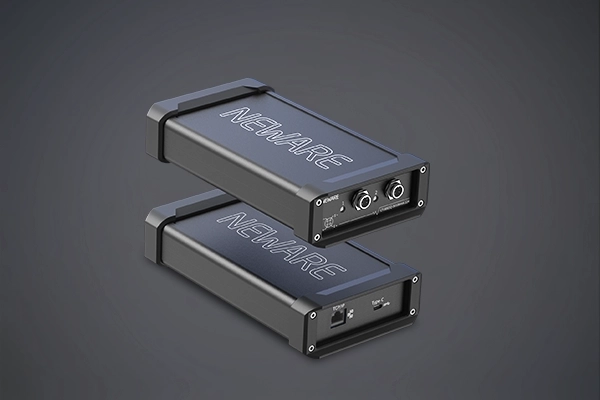
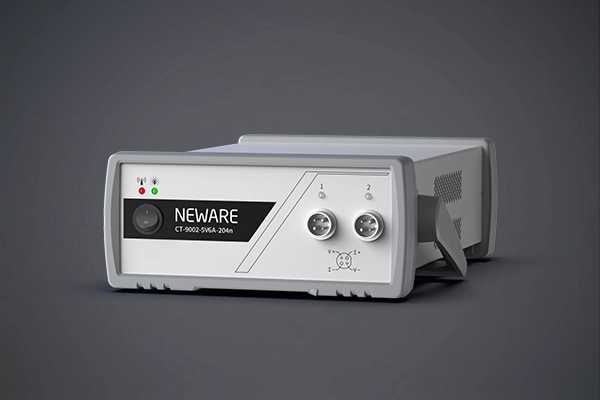
This operation video tutorial is applicable to the following products:
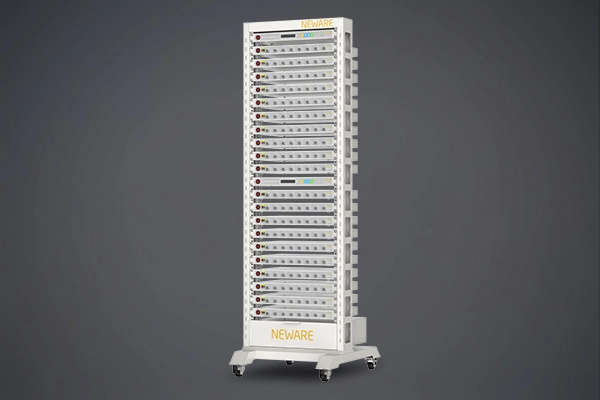
● CT-4000 Battery Testing System Series (CT-4008Q-5V100mA, CT-4008Q-5V6A-S1, CT-4008Q-5V6A-164, CT-4008Q-5V12A-S1, CT-4008Q-5V12A-164, etc.)
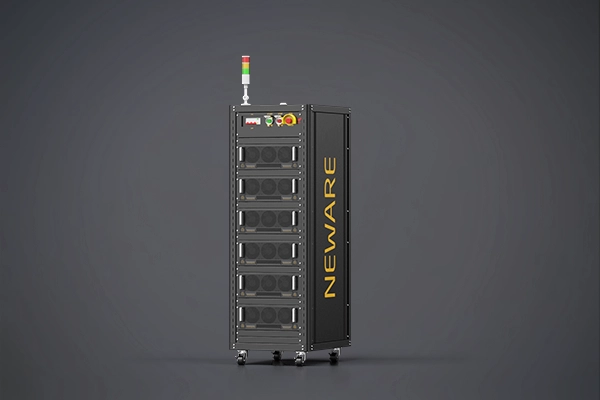
● CE-6000 Battery Testing System Series (Cell, Module, Pack, etc.)
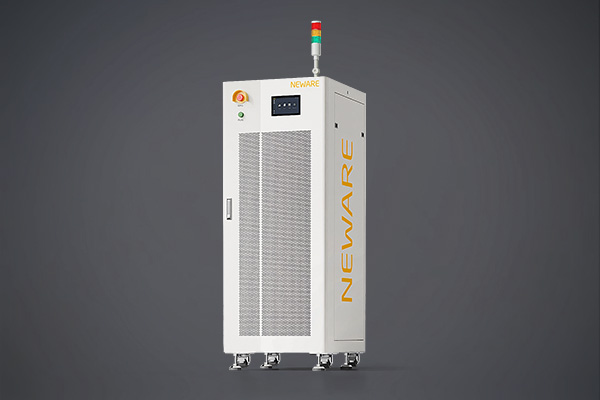
● CT/CTE-8000 Battery Testing System Series (CT-8002Q-5V100mA, CTE-8008-5V200A, etc.)
● All-in-One Battery Testing System Series (WHW-25L-S-16CH, WIHW-200-160CH-B, WHW-100L-2-160CH, WHW-500L-5V6A80CH-380V, WGDW-380L-2-40BFC-5V600A8CH, etc.)

